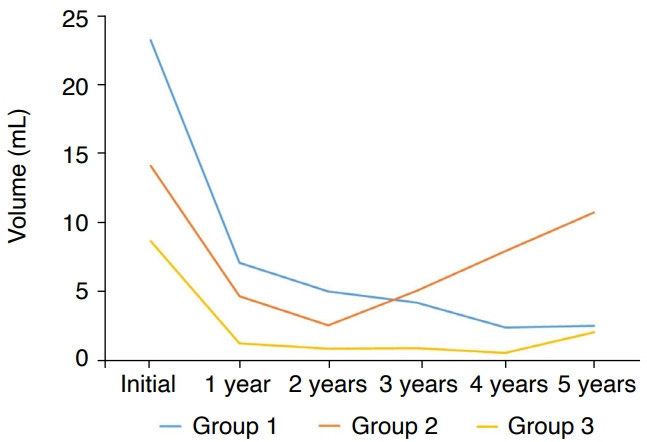
Fig. 2. Diagram showing changes in Vt according to the groups.

Group 1 show declining curve during follow-up period, while group 2 show a volume increase 2 years after RFA. Group 3 show a declining curve during 4 years, but its volume increased slightly at 5 years. Vt, total volume; RFA, radiofrequency ablation.
