
Figure 5.
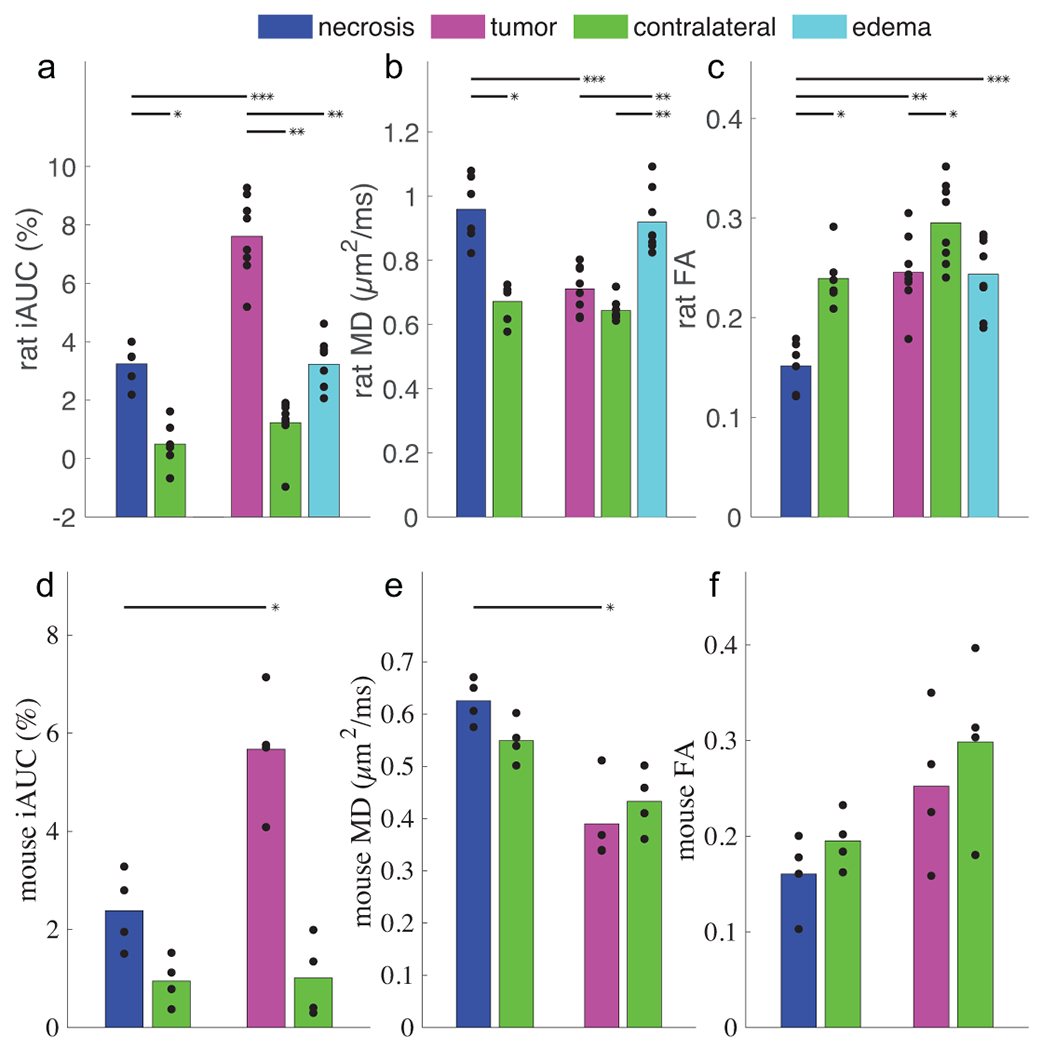
Summarized results of SSIFT iAUC (a,d), ADC (b,e) and FA (c,f) in different tissue types in rat (a-c) and mouse (d-f) subjects. Bar colors match the ROIs in Figure 4. Scatter points represent the ROI-averaged metric in individual subjects. Significance was tested with an unsigned and signed Wilcoxon rank sum test for inter- and intra-cohort comparisons, respectively. *** p < 0.001, ** p < 0.01, * p < 0.05.