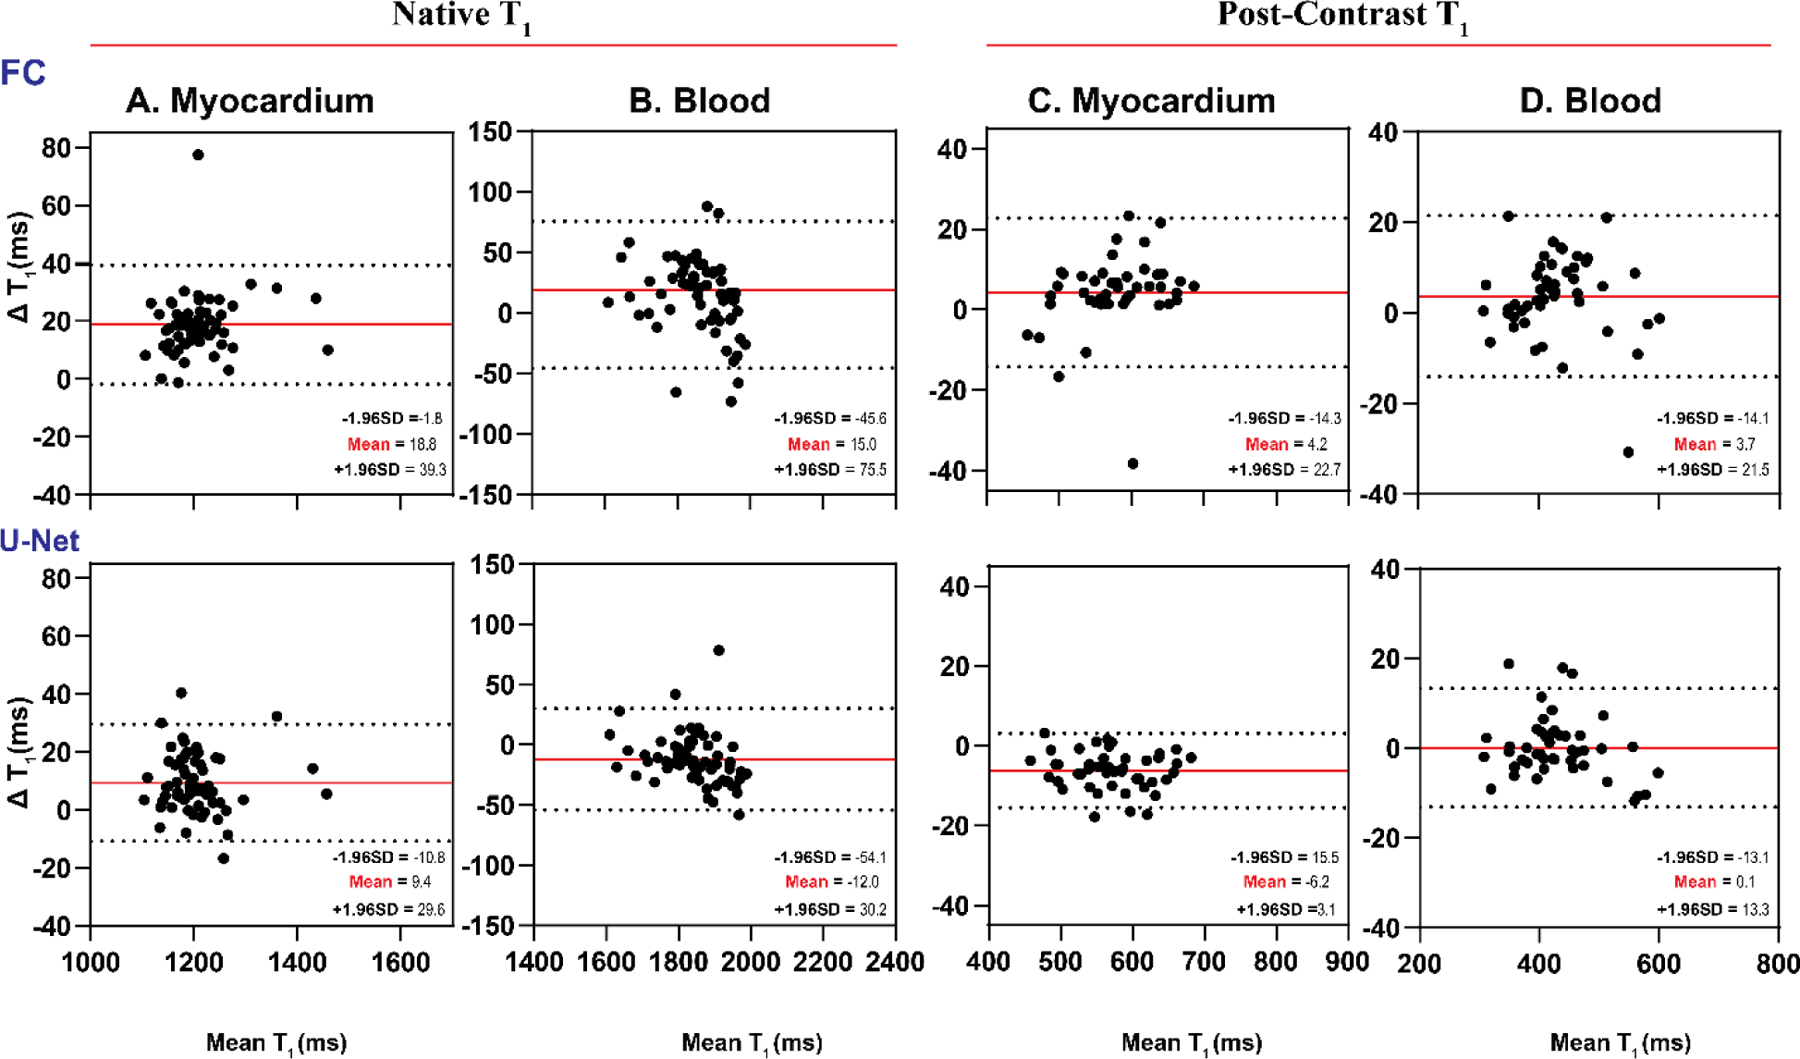
Figure 4:

Bland-Altman plots demonstrating agreement between MOLLI and MyoMapNet for myocardial and blood T1 values as calculated by FC and U-Net models using the existing in-vivo dataset (N=64). Mean differences and 95% limits of agreement are indicated in red and dotted lines, respectively. Each data point is averaged across three left-ventricular slices for each subject.
