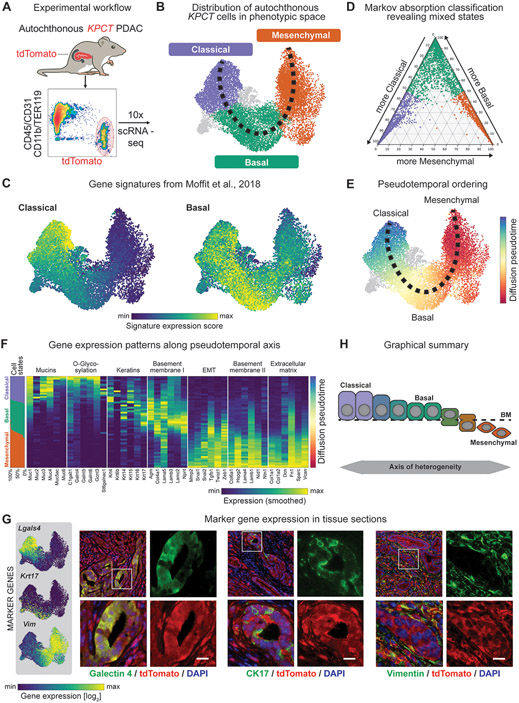
Figure 1. Single-cell profiling of autochthonous murine PDAC reveals a continuum of transcriptional cell states along the epithelial-mesenchymal transitional axis.
(A) Experimental workflow. (B). Uniform Manifold Approximation and Projection (UMAP) embedding of scRNA-seq profiles of 14,392 cells from 15 independent tumors, classified as classical (purple), basal (green) or mesenchymal cells (orange). (C) UMAP projection of previously described classical and basal expression profiles of scRNA-seq data. Scale represents gene signature score, with color scale from 1st to 99th percentile. (D) Ternary plot depicting the cell state classification probability of each cell, calculated by a Markov absorption classifier trained on a small subset of classical, basal and mesenchymal cells, colored by subtype (purple – classical; green – basal; orange – mesenchymal). (E) Diffusion-based pseudotemporal ordering of cells along the classical-basal-mesenchymal axis. (F) Expression of specific classical, basal, and mesenchymal gene signatures along the pseudotemporal axis. Columns represent the smoothed (sliding window smoother with n=250 cells) expression of individual genes along the pseudotemporal axis. The panel on the leftmost side shows the fractions of classical (purple), basal (green), and mesenchymal (orange) cells along the same pseudotime axis using the same smoothing approach. (G) Left: Representative UMAP embedding displaying the expression of candidate marker genes, Lgals4 (classical), Krt17 (basal), and Vim (mesenchymal). Scale represents size factor normalized log2-transformed UMI counts, with color scale from 1st to 99th percentile. Right: 400x Representative immunofluorescence images from KPCT PDAC tumors showing galectin-4, CK17, and vimentin in PDAC cells (green in respective panels, from left to right); tdTomato+ cancer cells are red. (H) Schematic depicting model of axis of heterogeneity in PDAC.

