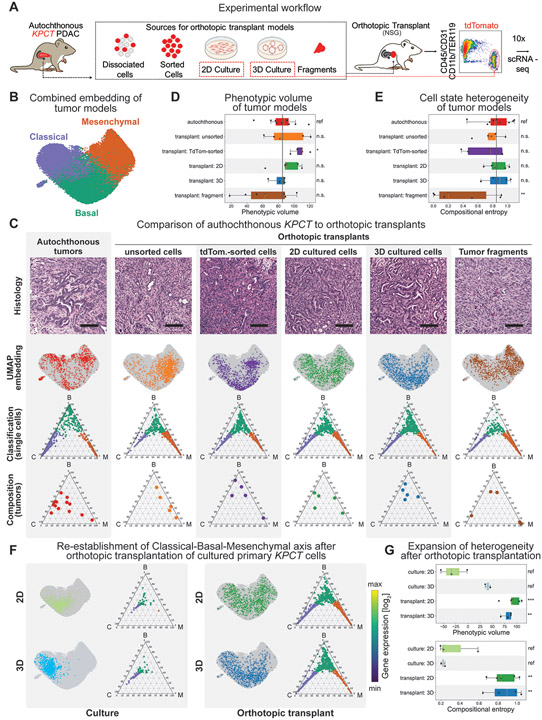
Figure 2. The fidelity of cancer cell states is dependent on the model system.
(A) Orthotopic modeling workflow. Note that in addition to orthotopic tumors, 2D and 3D cell cultures were also processed independently for scRNA-seq directly from culture conditions (red dashed box). (B) UMAP embedding of PDAC cells from autochthonous and orthotopic models after projection into the autochthonous gene expression space. Cells are colored according to subtype (purple – classical; green – basal; orange – mesenchymal) based on Markov adsorption classification. (C) Representative cellular heterogeneity in each PDAC model system. First row: PDAC tissues stained with hematoxylin and eosin at 200x magnification. Scale bar: 100 μm. Second row: UMAP embedding of each model system (colored dots) onto the full data set (grey dots) depicting the distribution of individual cells throughout phenotypic space. Third row: Ternary plots of predicted subtype probability per cell, calculated by Markov absorption colored by subtype (purple – classical; green – basal; orange – mesenchymal). Note that all models recapitulate all three cell states to some degree. Fourth row: Ternary plots depicting the overall subtype classification of each individual tumor sample (dots). Note some inherent sample-to-sample (inter-tumoral) heterogeneity in each model system. (D) Box plot of phenotypic volume based on unbiased global transcriptional heterogeneity of each model system calculated. Vertical black line represents the mean phenotypic volume of the autochthonous samples as reference. Higher values are associated with increased spread of cells over phenotypic space. Each dot represents an individual sample. (E) Box plot of the compositional heterogeneity based the relative frequency of classical, basal, and mesenchymal cells in each tumor. Values represent the Shannon entropy of the fractions of classical, basal, and mesenchymal cells. Higher values indicate a more balanced composition of cell states. Vertical black line represents the mean phenotypic volume of the autochthonous samples as reference. (F) Paired phenotypic heterogeneity in 2D and 3D organoid cell culture and orthotopic transplant. Left panel: Ternary plots of individual cells isolated from 2D (top) and 3D organoid cell culture (bottom). Right panel: Ternary plots of cells isolated from orthotopic tumors derived from the same cell culture conditions displayed on the left. Within each panel, the top plots display the cell state classification of all cells per model and their distribution in combined UMAP space. Note the in vitro enrichment of epithelial phenotypes, and the robust re-establishment of all cell states after orthotopic transplantation. (G) Box plots of (top) the phenotypic volume and (bottom) compositional entropy of cell in in vitro cell culture conditions and their matched orthotopic transplants.

