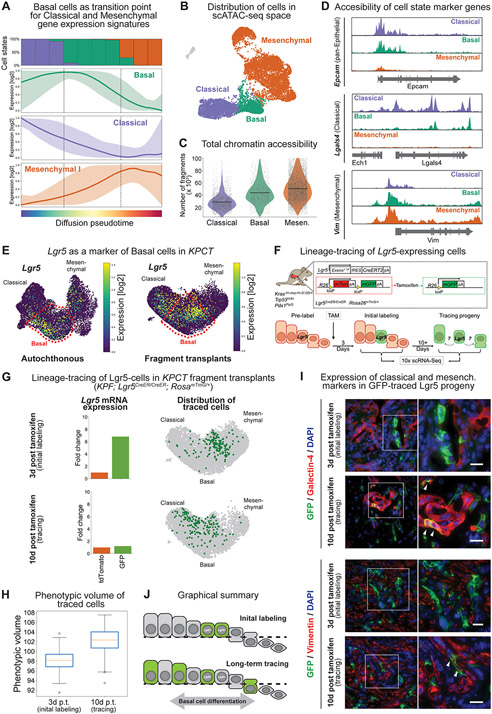
Figure 3. Lineage-tracing of a subset of basal state cells demonstrates functional phenotypic plasticity.
(A) Pseudotime analysis of cell states demonstrating mixed classical and mesenchymal expression profiles within the basal cell phenotype. Colored lines represent the average model-fitted expression of all pseudotime-dependent genes belonging to either the classical (purple), basal (green) and mesenchymal I (orange) gene expression clusters established in Fig. S2C. Shading represents the area between the 5th and 95th percentile of genes. The panel on the top shows the fraction of classical (purple), basal (green) and mesenchymal (orange) along the same pseudotime axis divided into ten bins. (B) Single-cell assay for transposase-accessible chromatin using sequencing (scATAC-seq) of autochthonous KPCT tumors at 7-8 weeks of age (n = 4). (C) Total chromatin accessibility, calculated as number of fragments per cell. (D) Accessibility of representative loci in each cell state. Note co-accessibility at classical (Lgals4) and mesenchymal (Vim) marker genes in the basal state. (E) Lgr5 overlaps with basal cell phenotype in the autochthonous (left) and fragment-based (right) tumor models. UMAPs displaying Lgr5 expression. Scale represents size factor normalized log2-transformed UMI counts, with color scale from 1st to 99th percentile. (F) Schematic of KPF; Rosa26mTmG/+; Lgr5CreER/CreER lineage-tracing system. (G) Lineage-tracing of fragment derived KPF; Rosa26mTmG/+; Lgr5CreER/CreER tumors. Top: Day 3 and Bottom: Day 10 post-tamoxifen labeling. Left; average expression of Lgr5 in tdTomato+ vs. GFP+ cells at day 3 and day 10. Note the initial enrichment of Lgr5 gene expression at day 3, which is no longer present at day 10, reflecting transition of the basal cells to other cell states. Right: UMAP embedding displaying the position of GFP+ traced cells either as single cells. Note how at day 3 the cells occupy a relatively restricted phenotypic space and diffuse over time. (H) Phenotypic volume of fragment derived GFP+ traced cells over time. (I) Immunofluorescence of the classical marker galectin-4 and mesenchymal marker vimentin in the Lgr5-traced cells. At initial labeling, Lgr5-traced cells express GFP but do not express galectin-4 or vimentin. Second insert shows traced cells at day 10, with white arrows indicating co-expression of GFP with galectin-4 (top) or vimentin (bottom) consistent with the acquisition of classical and mesenchymal phenotypes, respectively. (J) Graphical summary of lineage-tracing system demonstrating plasticity of the basal cell population.

