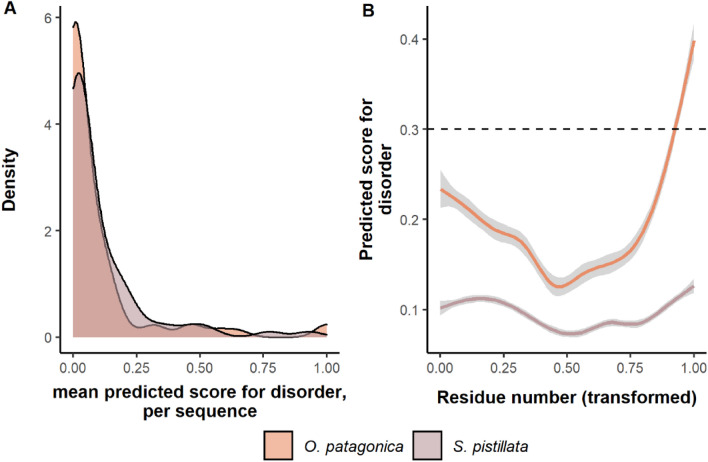
Figure 4.
Prediction of intrinsically disordered regions. (A) A density plot displaying the sequences’ disorder mean predicted score per species. (B) The average (± standard error in grey) of the disordered score per residue across SOM proteins with at least a single region predicted to be disordered. The residue number is represented as the percentage of the entire sequence. Regions with a score above the dotted line are predicted to be disordered.

