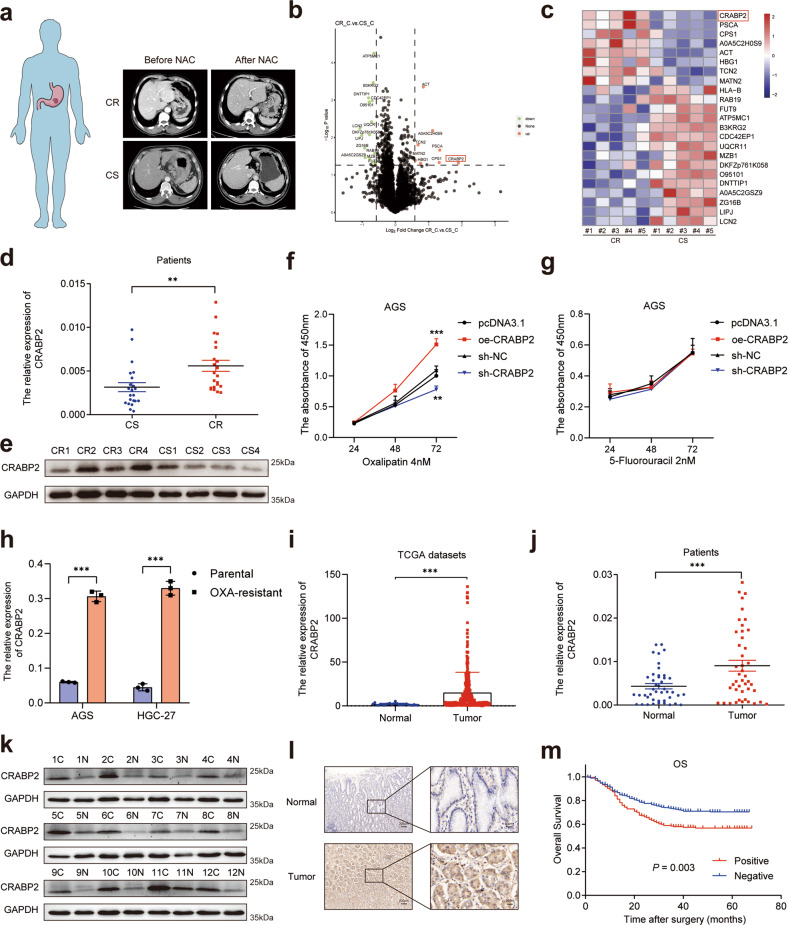
Fig. 1. The expression of CRABP2 was upregulated in chemoresistant GC patients and predicted prognosis.
a Typical image examples of CR and CS gastric cancer patients who received NAC. The volcano map (b) and heatmap (c) of the most upregulated/downregulated differentially expressed proteins in CR and CS tumor tissues. The qRT–PCR (d, n = 22) and western blotting (e, n = 4) results showed the expression of CRABP2 in tumor tissues of CR and CS patients. The CCK-8 results of AGS cells treated with OXA (f) or fluorouracil (g) after knockdown/overexpression of CRABP2. h The relative expression of CRABP2 in parental and OXA-resistant GC cells by qRT–PCR. i The expression of CRABP2 from the TCGA database (tumor = 335; normal = 26). Mann–Whitney U test (Wilcoxon rank sum test). The outlier values (median±2 IQR) and extreme values (median ± 3.5 IQR) were excluded. IQR: interquartile range. The expression of CRABP2 in tumor tissues and adjacent normal tissues of GC patients by qRT–PCR (j, n = 44) and western blotting (k, n = 12). l Typical IHC images of CRABP2-positive and CRABP2-negative tumor tissues. m The correlation curves between CRABP2 expression and OS of GC patients (n = 488). (CR chemotherapy resistance, CS chemotherapy sensitivity, OXA oxaliplatin, C tumor tissue, N normal tissues, IHC immunohistochemistry, OS overall survival). *P < 0.05, **P < 0.01, ***P < 0.001.

