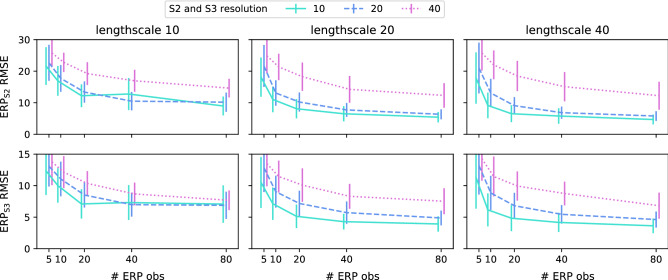
Figure 6.
Quantitative validation for ERP prediction, for different lengthscales (1 unit kernel lengthscale mm), number of observations, and S2 and S3 resolution. The model prediction is from the maximum a posteriori estimate. 32 basis functions are used for both EP parameter fields. For each combination of lengthscale, observations, and S2 and S3 resolution, 45 different samples of EP parameter fields are generated, and 5 different observation designs are used for each sample. The RMSE scores of ERP for each validation run is calculated over all mesh vertices. The error bars are 1 standard deviation.

