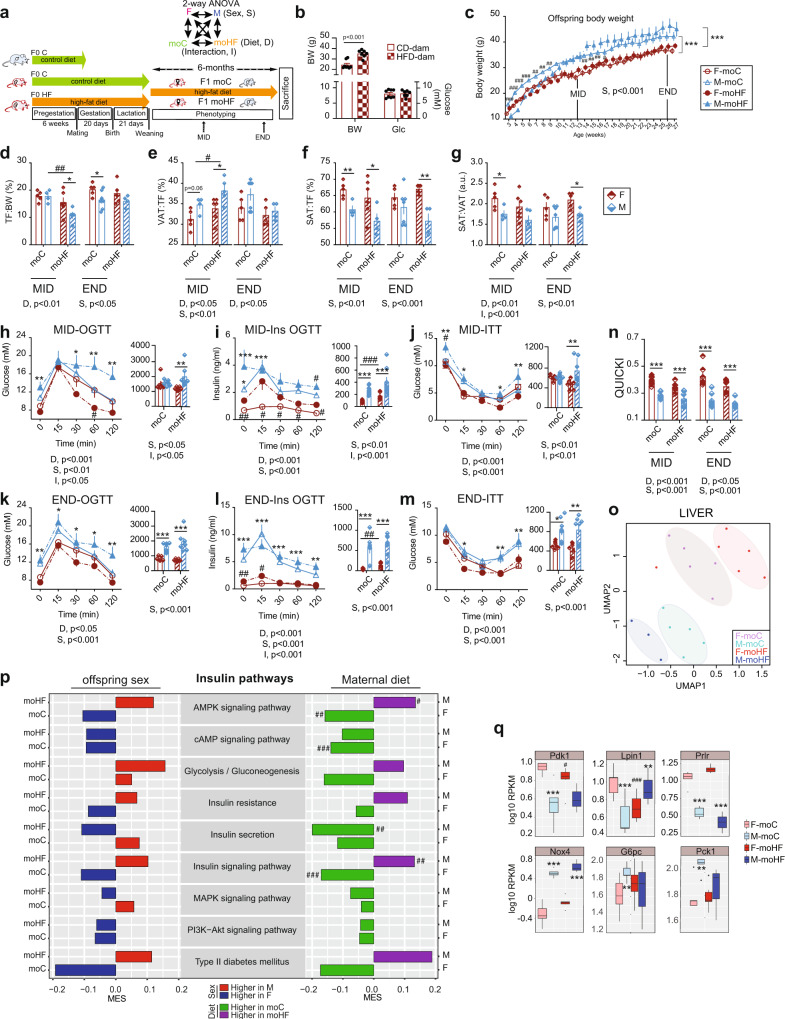
Fig. 1. Physiological and transcriptional response to maternal diet in obese F1 offspring is sex-dependent.
a Graphic description of the study set-up. Dam-F0 were fed either the control diet (C, green arrow) or the high-fat diet (HF, orange arrow) for 6 weeks prior mating and continued the same diet during gestation and lactation; male-F0 remained on C diet until mating. Both female and male F1 offspring remained on HF diet after weaning until sacrifice. The offspring physiological status was assessed in vivo at 3 months (MID) and 6 months (END) of age, using each animal as its own control. Explanatory scheme of the two-way ANOVA statistical comparisons. b Dam body weight (BW) and peripheral glucose level. c Time series plot of BW in female (F, red circle; open circle in moC and full circle in moHF) and male (M, blue triangle; open triangle in moC and full triangle in moHF) offspring until sacrifice; Bar graphs of the d total fat (TF) on BW, e visceral adipose tissue (VAT) on TF, f subcutaneous adipose tissue (SAT) on TF, and g SAT:VAT ratio in F-moC (red open bars), M-moC (blue open bars), F-moHF (red stripped bars), and M-moHF (blue stripped bars) based on MRI images analysis. h–m Time-course of the circulating glucose levels and the corresponding insulin levels during the oral glucose tolerance test (OGTT) at, h and i MID, and j and k END together with the area under the curve (AUC); glucose levels after insulin injection at l MID and m END together with the AUC. n Quantitative insulin-sensitivity check index (QUICKI) in F-moC (red open bars), M-moC (blue open bars), F-moHF (red stripped bars), and M-moHF (blue stripped bars); o UMAP plot of the RNAseq data in offspring’s liver. p Bar plot presenting the Maximum Estimate Score (MES) between sexes in moC and moHF offspring (left panel), and in response to MO in F and M (right panel) of the selected KEGG pathways involved in insulin and glucose metabolism; red and blue bars indicate higher expression in males and females, respectively, and green and purple bars indicate higher expression in moC and moHF, respectively. q Box plots of the expression level (RPKM, log10) of genes of the insulin pathways. For b, F-moC (n = 11), M-moC (n = 13), F-moHF (n = 11), and M-moHF (n = 10). For c–g, F-moC (n = 7), M-moC (n = 6), F-moHF (n = 7) and M-moHF (n = 7). For h–n, F-moC (n =8), M-moC (n = 9), F-moHF (n = 7), and M-moHF (n = 6). For o–q, F-moC (n = 5), M-moC (n = 5), F-moHF (n = 6), and M-moHF (n = 3). For b–m data are presented as mean ± sem; for q data are presented as mean ± sd. For c–n, two-way ANOVA (sex (S), mother diet (D), and interaction (I) between sex and diet followed by Tukey’s multiple comparisons test when significant (p < 0.05). For a and q, differences between two groups (sexes, F versus M; maternal diet, moC versus moHF) were determined by unpaired two-tailed t-test corrected for multiple comparisons using the Holm–Sidak method, with alpha = 5.000%. For pathway and DE genes analysis we used the Benjamini–Hochberg correction with false Discovery Rate (FDR) values <0.1 when significant. *, M versus F and #, moHF versus moC, p < 0.05; ** or ##, p < 0.01; *** or ###, p < 0.001. RPKM: Reads Per Kilobase of transcript, per Million mapped reads.

