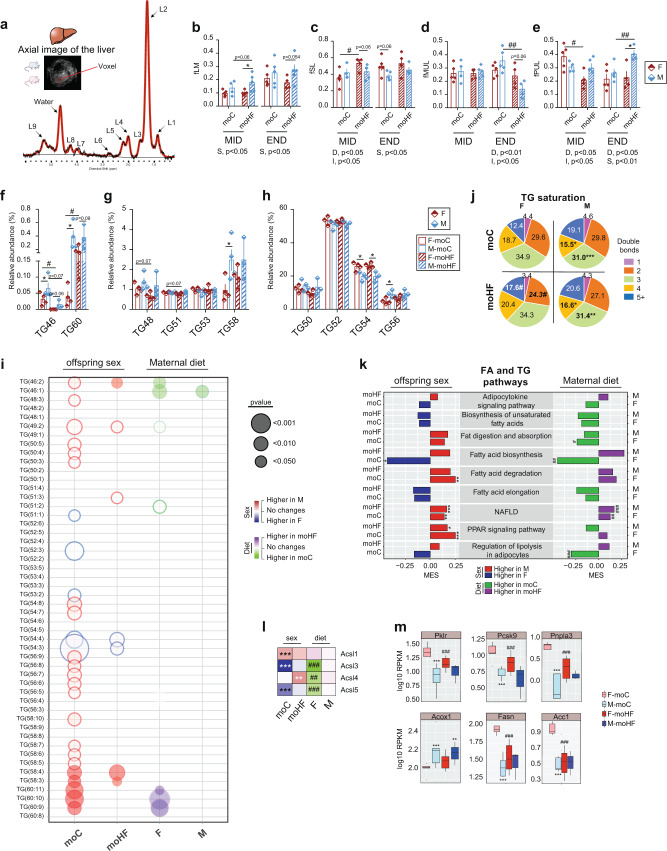
Fig. 2. Maternal obesity adjusts the triglycerides composition in the liver of offspring and causes sex-dependent transcriptional alterations.
Female (F, red bars) and male (M, blue bars) offspring born from C diet mothers (moC, open bars) and from HF diet mothers (moHF, stripped bars) at MID and END. a Representative axial image of the liver with single voxel spectroscopy and one representative proton spectrum used for in vivo quantification of the fraction of b lipid mass (fLM), c saturated lipids (fSL), d monounsaturated lipids (fMUL), and e polyunsaturated lipids (fPUL). f–h Relative abundance of TG classes in the liver; i bubble plot of the significantly changed relative level of TG species in liver extracts; j pie charts showing the hepatic TG saturation profile; k bar plot presenting the MES between sexes in moC and moHF (left panel), and in response to MO in F and M (right panel) of the KEGG pathways involved in the FA and TG metabolism. Red and blue bars indicate higher expression in M and F, respectively, and, green and purple bars indicate higher expression in moC and moHF, respectively. l Heatmap of the log2 fold change expression levels of the Acsl family genes, and m Box plots showing expression (RPKM, log10) of selected genes involved in the FA and TG pathways. For b–e, F-moC (n = 5), M-moC (n = 9), F-moHF (n = 5), and M-moHF (n = 5). For f–j, F-moC (n = 4), M-moC (n = 4), F-moHF (n = 4), and M-moHF (n = 3). For k–m, F-moC (n = 5), M-moC (n = 5), F-moHF (n = 6), and M-moHF (n = 3). For b–h, data are presented as mean ± sem; for m, data are presented as mean ± sd. For b–e, two-way ANOVA (sex (S), mother diet (D), interaction and (I) between sex and diet) followed by Tukey’s multiple comparisons test when significant (p < 0.05). For I, m, differences between two groups (sexes, F versus M; maternal diet moC versus moHF) were determined by unpaired two-tailed t-test corrected for multiple comparisons using the Holm–Sidak method, with alpha = 5.000%. For pathway and DE genes analysis we used the Benjamini–Hochberg correction with FDR < 0.1, when significant. *, M versus F and #, moHF versus moC, p < 0.05; ** or ##, p < 0.01; *** or ###, p < 0.001.

