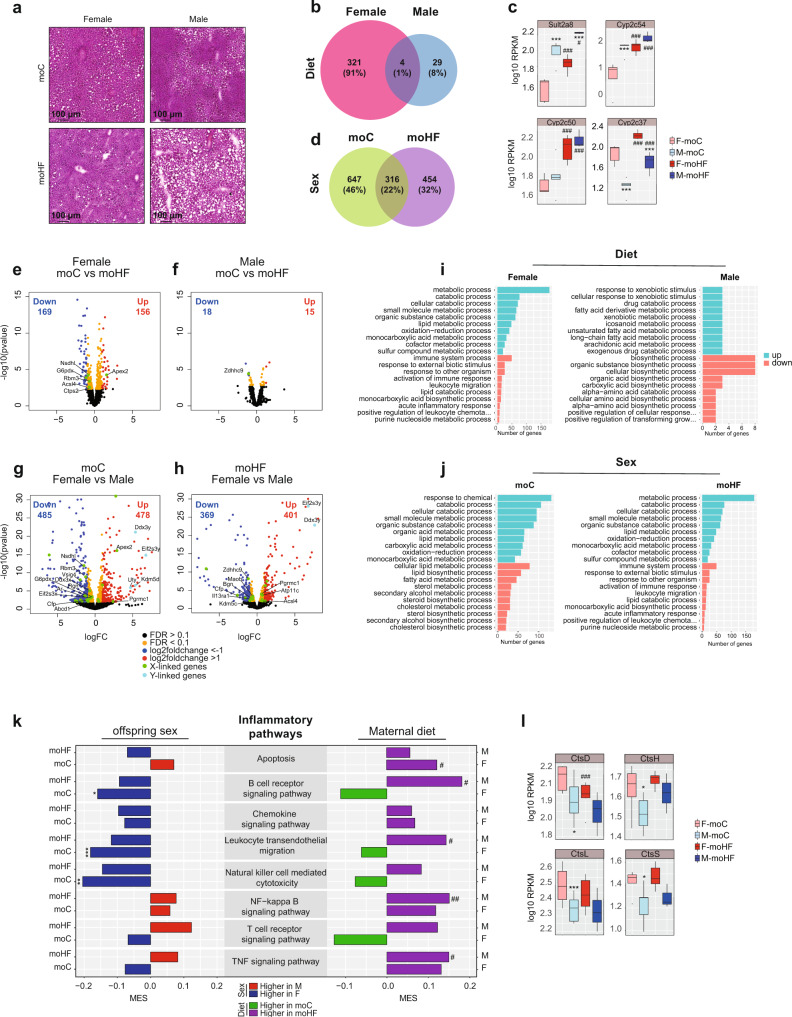
Fig. 4. Maternal obesity promotes hepatic inflammatory response in male offspring.
a Hematoxylin-eosin (H&E) staining of frozen liver sections from moC and moHF offspring; Venn diagram of the DE genes in response to MO, in b females (F) and males (M) and between sexes in d moC and moHF. c Box plots showing expression (RPKM, log10) of the four DE genes by MO shared between sexes; Volcano plots of the DE genes in response to MO in e F and f M and between sexes in g moC and h moHF with selected genes linked to the X- and Y-chromosomes. Genes residing on the X-chromosome are marked in green and those on the Y-chromosome are marked in light blue; top 10 significantly up and top 10 significantly down enriched biological GO terms in response to MO in i F and M; and between sexes in j moC and moHF. k Bar plot presenting the MES between sexes in moC and moHF (left panel) and in response to MO in F and M (right panel) of the KEGG pathways involved in inflammation. Red and blue bars indicate higher expression in M and F, respectively, and green and purple bars indicate higher expression in moC and moHF, respectively. l Box plots showing expression (RPKM, log10) of selected genes involved in the inflammatory pathways. For volcano plots: Significantly upregulated (log2FC > 1) and downregulated (Log2FC < −1) genes are presented as red and blue dots, respectively. Orange dots indicate the genes that are significantly changed (FDR < 0.1). Black dots indicate not significant (FDR > 0.1). For a F-moC (n = 3), M-moC (n = 3), F-moHF (n = 4), and M-moHF (n = 2). For b–l, F-moC (n = 5), M-moC (n = 5), F-moHF (n = 6), and M-moHF (n = 3). For c and l, data are presented as mean ± sd. Differences between two groups (sexes, F versus M; maternal diet moC versus moHF) were determined by unpaired two-tailed t-test corrected for multiple comparisons using the Holm–Sidak method, with alpha = 5.000%. For i, j, significance was determined using Fisher’s Exact test with P values ≤0.05. For pathway and DE genes analysis we used the Benjamini–Hochberg correction with FDR < 0.1 when significant. *, M versus F and #, moHF versus moC, p < 0.05; ** or ##, p < 0.01; *** or ###, p < 0.001.

