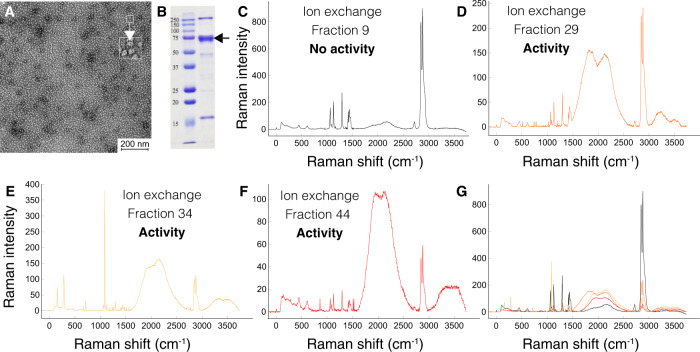
Fig. 4. GmSal content functional characterization.
A Electron microscopy negative staining of a saliva sample, dilution 1:500. Protein complexes (10–15 nm size) are indicated in the top right square. B SDS-PAGE of a GmSal sample, dilution 1:50. Molecular weight standards are listed on the left. The arrow indicates the major band at 75 kDa. C–F. RAMAN of PE treated with IEX fractions (see Fig. S4). C Fraction 9, no activity (control PE film, see Fig. 1 for details). D–F Profile corresponding to IEX peak 1 (fraction 29), 2 (fraction 34) and 3 (fraction 44) (see Fig. 1 for details). The intense peak at 1085 cm−1 in E indicates amorphous PE. The decrease of the peaks at 2845 and 2878 cm−1 indicates a less significant presence of PE. G Overlapping of fractions C to F. Experiments in figures A, B were performed multiple times (>5). Source data are provided as a Source Data file.

