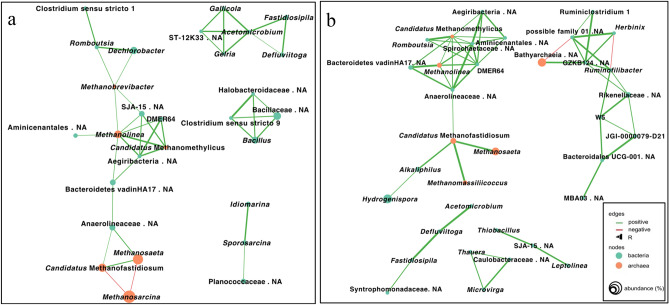
Figure 3.
Co-occurrence network analysis based on the correlation of the relative abundance of amplicon sequence variant (ASV) reads for the microbial profiles at the genus level or the closest classified taxonomic level. (a) after the drying-rewetting and (b) incubation events. Bacterial and archaeal groups are shown by nodes in green and orange, respectively. Each edge represents significant correlations between pairs of nodes (p ≤ 0.001), where positive and negative correlations are coloured in green and red, respectively. The thickness of the edge is proportional to the R value of the correlation (R ≥ 0.5).

