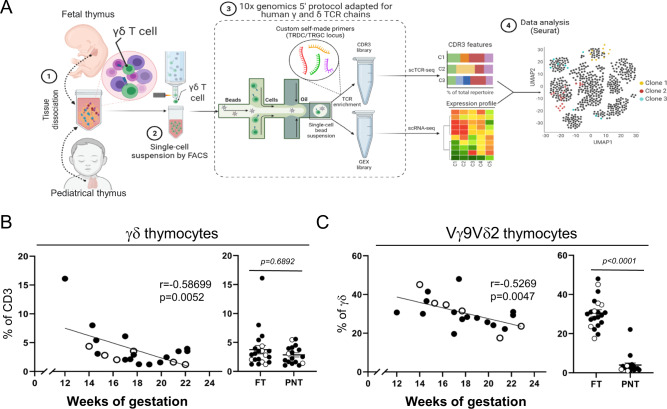
Fig. 1. Experimental approach.
A γδ T cells were sorted from human fetal and pediatric thymuses and were subjected to a modified version of 10x genomics 5′ protocol in order to amplify CDR3δ and CDR3γ regions. Flow chart created with BioRender.com. B Frequency (%) of γδ thymocytes out of total CD3+ living cells. C Frequency (%) of Vγ9Vδ2 thymocytes out of γδ+ thymocytes. R and p values (two-tailed) in B, C were obtained by doing Spearman correlation test in the gestation age graphs, while dot plots were analyzed by two-tailed unpaired t-test. B, C White dots indicate samples used in the sc RNA/TCR-seq experiments. “FT” group: fetal thymus. “PNT” group: post-natal thymus/pediatric thymus. Source data are provided as a Source Data file. See also Supplementary Fig. 1.

