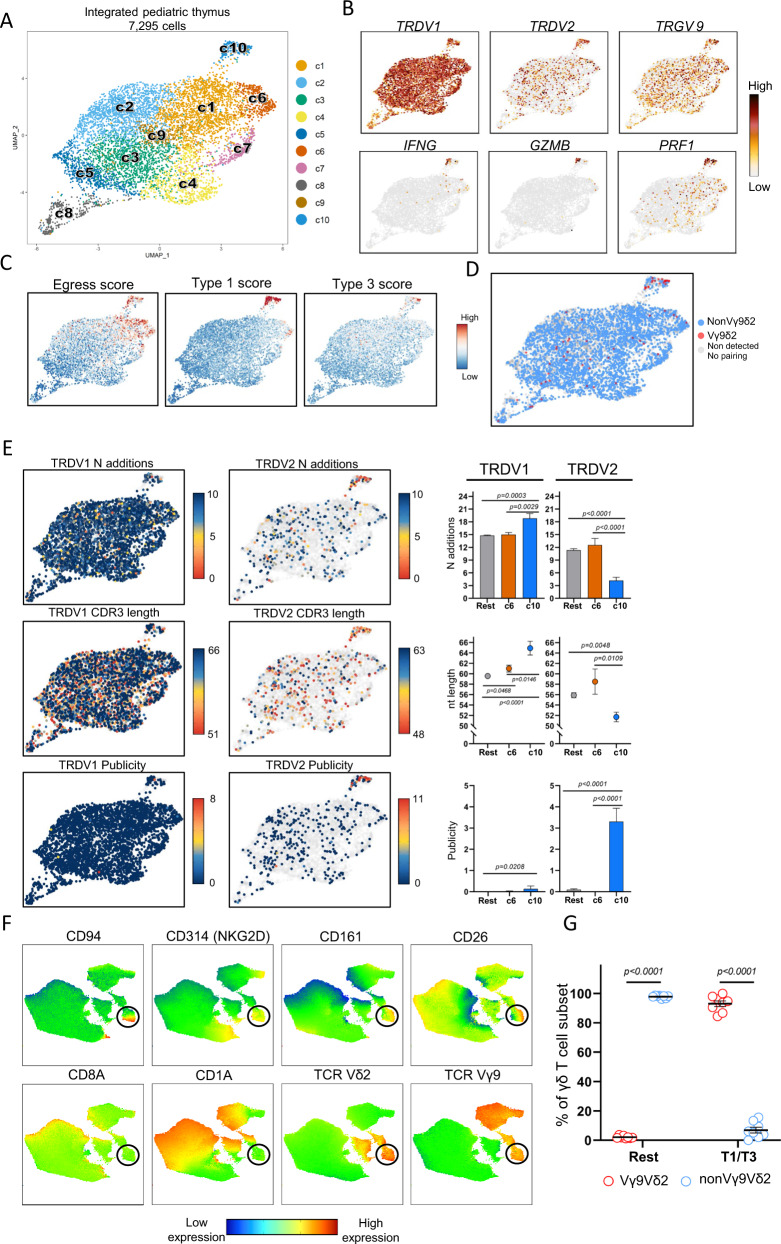
Fig. 8. The pediatric thymus generates a small Vγ9Vδ2 type 1/type 3 effector subset.
Single γδ thymocytes from pediatric thymus samples (n = 3; 4.0, 4.5, and 11.0 years) were sorted in three independent experiments. After quality control 7295 cells were subjected to downstream analysis. A UMAP visualization of the annotated clusters obtained after integration of the samples. B Expression levels of selected genes in the UMAP plot. C Projection of egress (left), Type 1 (middle), and Type 3 (right) module scores computed using different set of marker genes (Supplementary Data 5). Each cell is colored based on their individual score. D UMAP plot displaying Vγ9Vδ2 cells based on CDR3 data. Cells without paired TRD and TRG chain are displayed as light gray dots in the UMAP. E, left and center: UMAP plots displaying N additions (top), CDR3 nt length (middle), and CDR3 publicity levels (bottom) of TRDV1-containing (left) and TRDV2-containing (center) sequences. Light gray dots in the UMAP plots indicate cells with CDR3δ segments using different TRDV than TRDV1 (left) or TRDV2 (center) gene segments. Upper limit color scale of N additions UMAP plots represent sequences containing 10 or more N additions. Cells with a publicity level of 0 (navy blue color in UMAP) have a private TRDV2 sequence which is only present in one sc TCR-seq library. F UMAP plots derived from flow cytometry data indicating the expression levels of distinct surface markers. UMAP plots include 28,421 live CD3+ γδTCR+ thymocytes from 5 different pediatric thymus samples. Black circles are used to facilitate the location of the small effector blended Vγ9Vδ2 cluster. G Dot plot indicating the frequency (%) of Vγ9Vδ2 and nonVγ9Vδ2 thymocytes at protein level in the T1/T3 (effector blended) cells (CD1a-CD94+CD161hi + CD26+) and the rest group (CD1a-CD94-CD161-). E, G Displayed error bars are means ± SEM. Data in E was analyzed by Kruskal–Wallis test followed by two-tailed Dunn’s multiple comparisons test. In G, comparisons between Vγ9Vδ2 and nonVγ9Vδ2 subsets in the distinct effector clusters were performed using two-tailed Wilcoxon-matched paired tests. “Rest” group: all clusters except c6 and c10 in A. Source data are provided as a Source data file. See also Supplementary Figs. 11–13.

