Fig. 1.
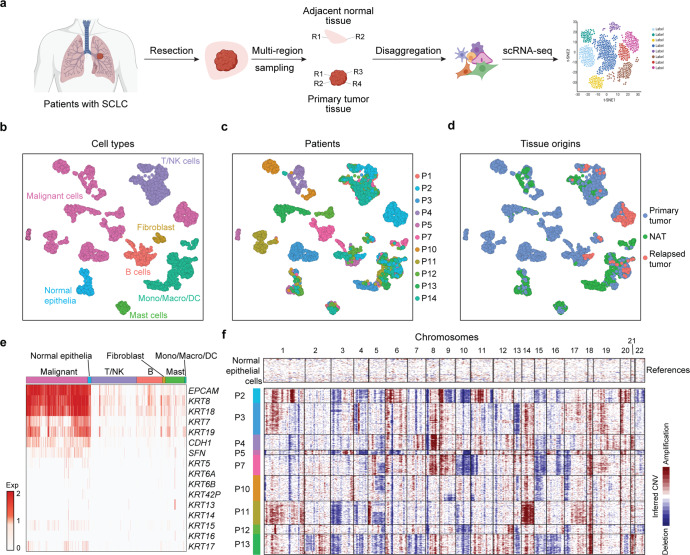
scRNA-seq profiling of the landscape of SCLC. a Experimental design. Schematic of the experimental workflow for the collection and processing of fresh tissue samples of SCLC tumors and matched normal lung tissues adjacent to the tumor for scRNA-seq (created with BioRender. com). b–d UMAP plot of all cells clustered and color coded by cell type (b), patient (b), and tissue origin (d). Clusters were assigned to the indicated cell types by differentially expressed genes (DEGs), as shown in (b) (Supplementary Fig. S1b). e Epithelial gene expression across all cell types in the TME, including malignant cells (malignant), normal epithelial cells (normal epithelia), T/NK cells (T/NK), B cells (B), fibroblasts, mast cells (Mast), and monocytes/macrophages/dendritic cells (mono/macro/DC). f Heatmap shows large-scale CNVs in malignant cells (rows) from 9 of the 11 SCLC patients. There were almost no malignant cells from SCLC-P1 and SCLC-P14 because these two patients received neoadjuvant treatment. The inferred CNVs were deduced for each single cell based on the average expression profiles across chromosomal intervals. Normal epithelia from NATs were used as references. Red: amplification; blue: deletion

