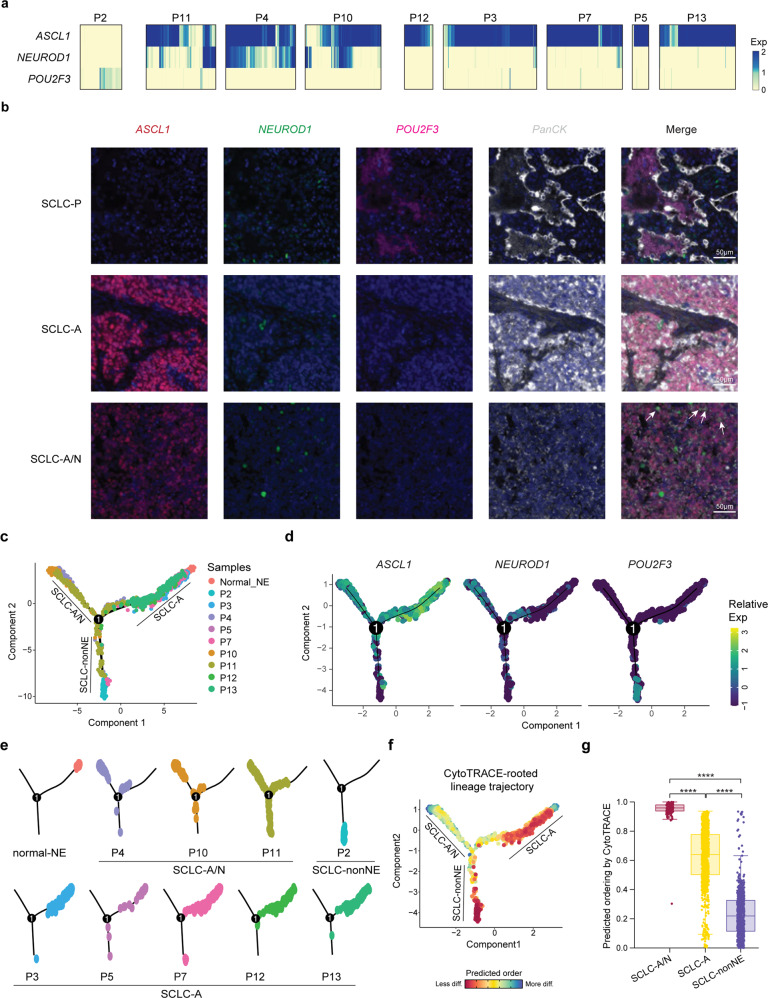
Fig. 4.
Intertumor heterogeneity and ITH of the molecular subtypes of SCLC defined by the expression of key TFs. a Expression of ASCL1, NEUROD1 and POU2F3 in individual cells from nine patients. b Multiplex immunofluorescence imaging shows the expression patterns of ASCL1 (red), NEUROD1 (green) and POU2F3 (pink) in SCLC samples at the protein level, in accordance with the expression patterns of key transcriptional regulators. PanCK (gray) was used to stain epithelial cells in SCLC tumors. DAPI was used to label cell nuclei. Scale bars, 50 µm. White arrows indicated co-expression of ASCL1 and NEUROD1. c Pseudotime trajectory of malignant SCLC cells in a two-dimensional state space inferred by Monocle 2. Monocle components were correlated with the SCLC-A, SCLCA/N and SCLC-non-NE clusters. Each dot corresponds to one single cell, colored according to its patient of origin. d Relative expression of ASCL1, NEUROD1 and POU2F3 in three trajectory branches. e Faceted pseudotime plots indicating the distribution of cells from each patient. f Combined application of CytoTRACE and Monocle 2 to dissect SCLC differentiation. diff, differentiated. g Boxplots showing CytoTRACE values for three Monocle branches in (f). Statistical analyses were performed using the Wilcoxon signed-rank test. ****p-value < 0.0001

