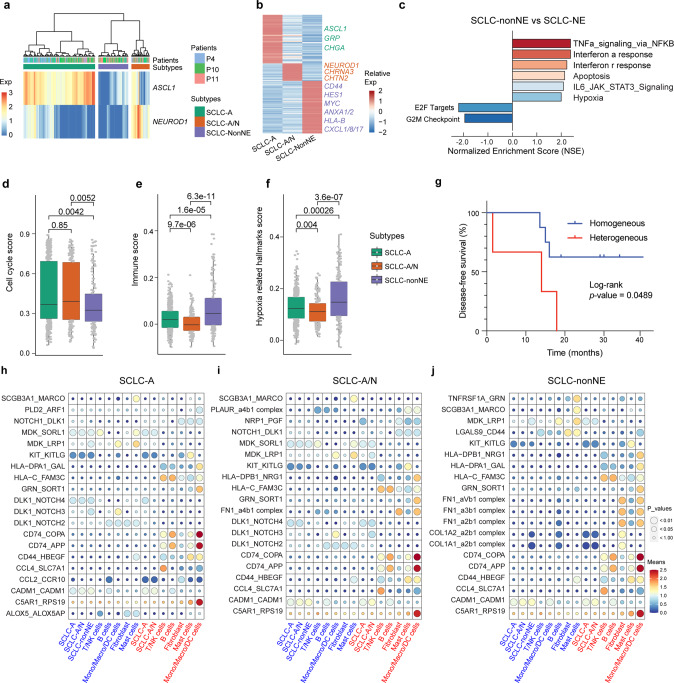
Fig. 5.
Inter/intratumor heterogeneity of the subtypes of SCLC defined by the expression levels of ASCL1 and NEUROD1. a Hierarchical clustering of ASCL1 and NEUROD1 expression in malignant cells from P4, P10 and P11 revealed three main clusters. b Heatmap shows the DEGs among the three clusters, with interesting genes indicated in corresponding colors. c GSEA was performed to interpret gene expression data from the SCLC-non-NE cluster compared with the SCLC-NE cluster (including SCLC-A and SCLC-A/N). d–f Scores of the three subtypes regarding the cell cycle- (d), immune- (e) and hypoxia-related (f) hallmarks described in Fig. 2. The boxes display the interquartile range (IQR = Q3–Q1; the 25th (Q1) to the 75th percentiles (Q3)), with the centerline denoting the median. Whiskers were drawn to represent Q1 minus 1.5 × IQR and Q3 minus 1.5 × IQR. All other observed points are plotted as outliers. Dots were added to box plots using the function geom-dotplot. Statistical analyses were performed using one-way ANOVA followed by Bonferroni’s multiple comparisons test, with the p-values indicated. g Disease-free survival (DFS) was analyzed by the comparison of 3 SCLC patients (heterogeneous) to 6 other SCLC patients (homogeneous). The log-rank test was performed to indicate a difference with a p-value of less than 0.05. h–j Dot plots derived from CellPhoneDB show selected ligand–receptor interactions (top 20 based on the expression level) from SCLC-A (h), SCLC-A/N (i) and SCLC-non-NE (j) clusters with other clusters or cell types. The size of the circle represents the p-values. The means of the average expression level of interacting pairs are indicated by color. The cell clusters labeled blue and red on the ‘x’-axis indicate that they act as receptors and ligands in the interaction pairs, respectively

