Fig. 6.
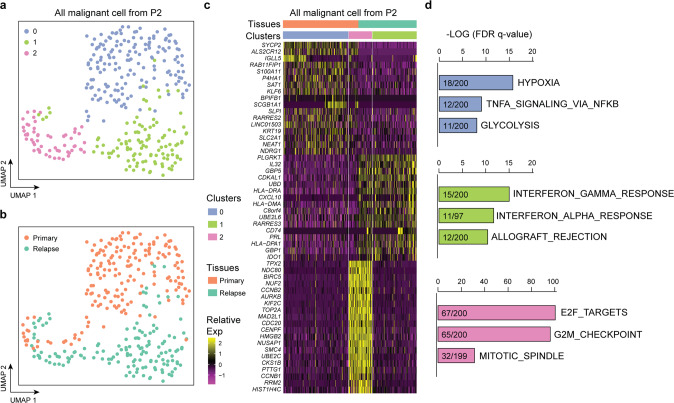
ITH of SCLC is recapitulated in relapsed tumors. a UMAP plot of malignant cells from SCLC-P2 revealed three specific clusters (indicated by color). b UMAP plot of malignant cells from SCLC-P2 revealed specific clusters in the primary and relapsed tumors by the cell of origin. c Heatmap shows the DEGs and related pathways that correspond to the primary and relapsed tumors, as well as the three specific clusters. d GSEA of all DEGs using hallmark gene set collections. The top 3 enriched hallmarks (ranked by the FDR q-values) along with the number of mapped and total genes in the pathways are shown

