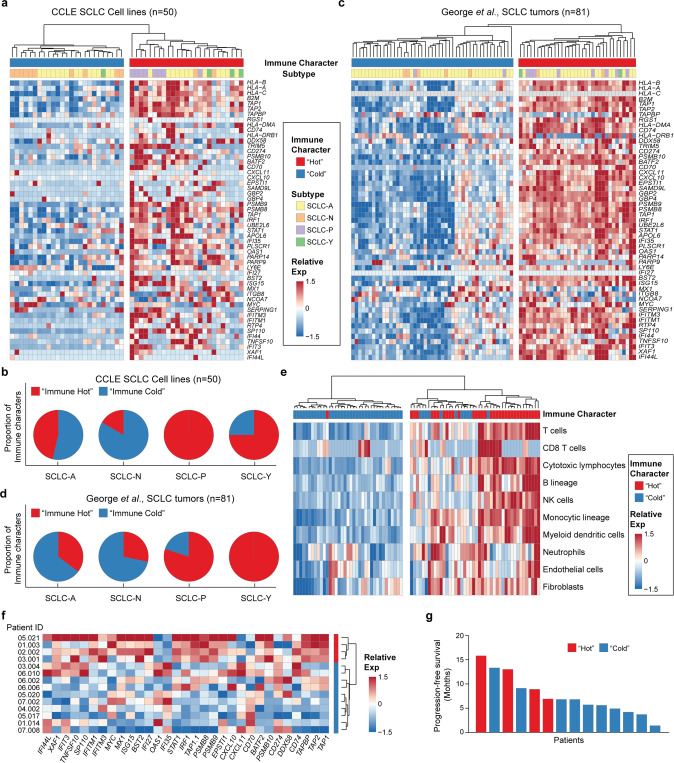
Fig. 7.
SCLC subtypes associated with different immune microenvironments. a, b Heatmap of gene expression according to the immune signatures shown in Fig. 3e in 50 SCLC cell lines from the CCLE (a) and 81 SCLC tumor samples described by George et al. (b). The immune characteristics of “hot” and “cold” tumors, as well as SCLC subtypes, are indicated. c, d Pie charts illustrate the proportion of different immune characteristics in SCLC subtypes from 50 SCLC cell lines from the CCLE (c) and 81 SCLC tumor samples described by George et al. (d). e Qualitative and quantitative analyses of the abundance of eight immune and two stromal cell populations in 81 SCLC tumor samples described by George et al. f Heatmap of gene expression according to the immune signatures shown in Fig. 3e in 14 SCLC patients who received ICB treatment. g Progression-free survival (PFS) of these 14 SCLC patients. The immune “hot” (red) and “cold” (blue) characteristics are indicated

