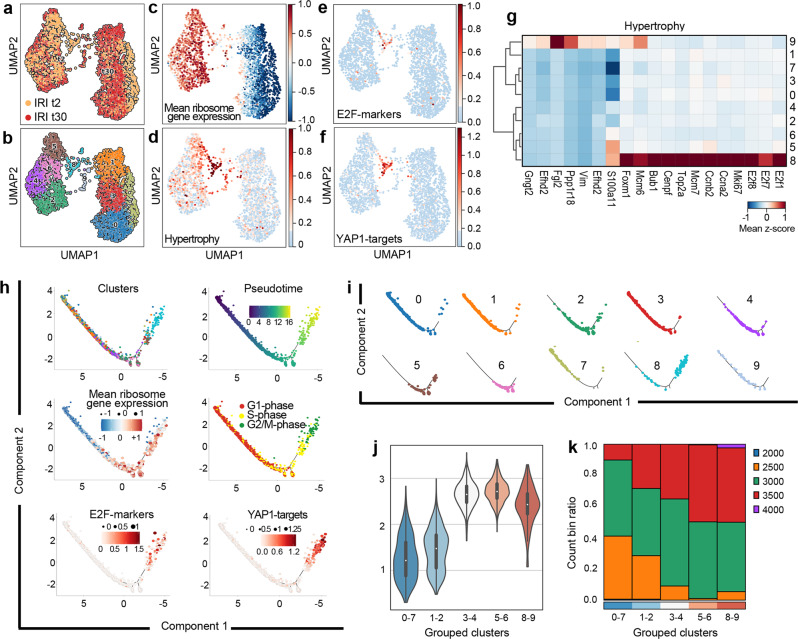
Fig. 3. Polyploidization of proximal tubular cells (PTC) after AKI in mice is controlled by YAP1.
a UMAP of experimental time distribution and b cluster distribution of mouse PTC at day 2 (t2) and 30 (t30) after IRI. c UMAP showing ribosome gene expression difference and d hypertrophy genes (Top2a, Mcm7, Ccna2, Ccnb2, Tmsb10, S100a11). e UMAP showing E2F-markers (E2f1, E2f7, E2f8) and f YAP1-targets (Ankdr1, Birc5, Ctgf, Cdk1, Ccnb1, Akt1) in PTC. g Matrix plot of PTC at 2 and 30 days after IRI, showing hypertrophy genes. h Monocle2 trajectory of PTC clusters and trajectory of PTC coloured by pseudotime, mean ribosome gene expression difference, cell cycle phases, E2F-markers (E2f1, E2f7, E2f8) and YAP1-targets (Ankdr1, Birc5, Ctgf, Cdk1, Ccnb1, Akt1). i Monocle2 “facet” trajectory showing cluster distribution in order of appearance. j Violin plots showing ribosome distribution in clusters grouped by ribosome gene expression. Median distribution is represented by the white dot; the black bar in the centre of the violin represents the interquartile range between the first and third quartile; the black lines stretched from the bar represent the lower/upper adjacent values defined as first interquartile −1.5 and third interquartile +1.5, respectively. k Bar plot showing the binned normalized counts distribution in each cluster group. IRI ischemia reperfusion injury.

