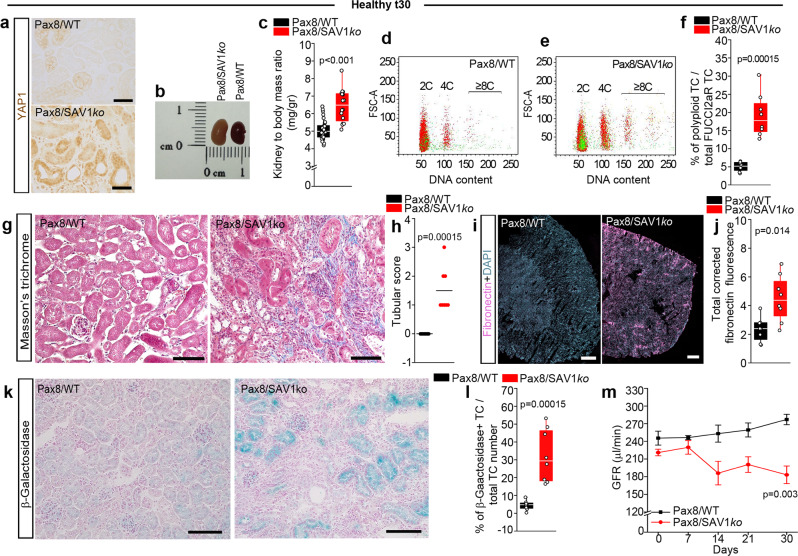
Fig. 6. Pax8/SAV1ko healthy mice show increased tubular cell (TC) polyploidization and spontaneously progress toward CKD.
a Representative pictures for immunohistochemistry of active-YAP1 staining. Bars 100 µm. A representative experiment out of 4 is shown. b Picture of Pax8/FUCCI2aR/SAV1ko (Pax8/SAV1ko) and Pax8/WT kidneys. c Kidney weight in Pax8/WT (n = 30) and Pax8/SAV1ko mice (n = 16), p = 7.2 × 10⁻⁶. FACS plots of TC in d Pax8/WT and in e Pax8/SAV1ko mice, showing diploid (2C), tetraploid (4C) and octaploid or greater (≥8C) TC. Colours match the FUCCI2aR reporter (n = 8). f Percentage of polyploid TC (n = 8). g Representative pictures of Masson’s trichrome staining (n = 8). Bars 100 µm. h Tubular score evaluated on Masson’s trichrome staining (n = 8). i Sequential scanning of kidney section stained for fibronectin. DAPI counterstains nuclei. Bars 500 µm. j Quantification of fibronectin deposition by digital morphometry (n = 8). k Senescence-associated β-galactosidase assay (n = 8). Bars 100 µm. l Percentage of β-galactosidase+ TC (n = 8). m GFR measurement for 30 days (n = 5). Statistical significance was calculated by two-sided Mann-Whitney test; numbers on graphs represent exact p values or are provided in the legend. Two-way ANOVA test of significance followed by Bonferroni post-test was employed for graph m. Data are expressed as mean ± SEM in graph m. Box-and-whisker plots: line = median, box = 25–75%, whiskers = outlier (coef. 1.5).

