
FIGURE 1.
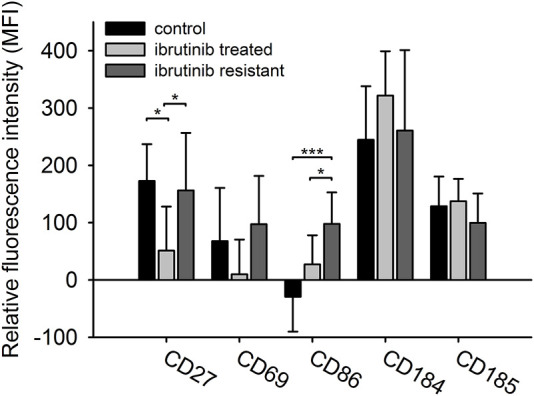
The immunophenotype of CLL cells in different treatment cohorts. The expression level of five different surface markers (CD69, CD184, CD27, CD86, CD185) in three different cohorts (treatment naïve n = 10, ibrutinib sensitive n = 7, ibrutinib resistant n = 11) were measured by flow cytometry. Relative median fluorescent intensity (MFI) values were calculated as the difference between the MFI value of internal negative controls and B-cells. ANOVA or Kruskal-Wallis test with Holm-Sidak post hoc test were performed for statistical evaluation. *p < 0.05; **p < 0.01.