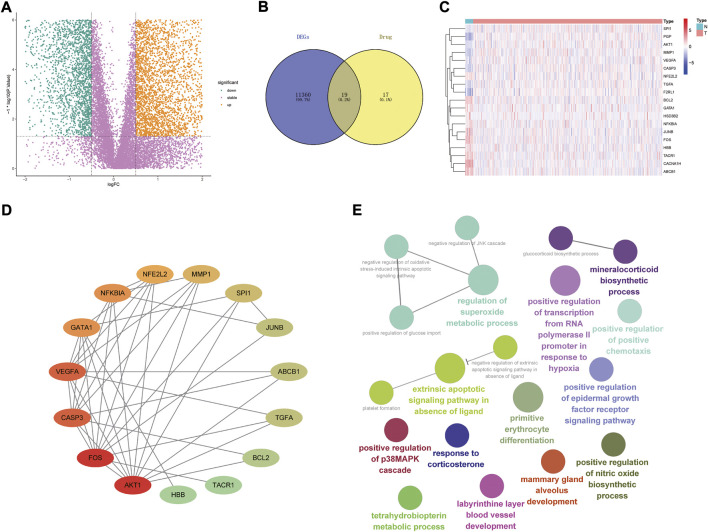
FIGURE 2.
Interaction relationship and enrichment analysis of drug-associated differential genes; (A) Volcanoes of 6,989 endometrial cancer differential genes; (B) Venny diagram of 19 drug-associated differential genes; (C) Heat map of 19 drug-differential genes (N represents normal group, T represents tumor group; red represents high gene expression, blue represents low gene expression, the depth of colour represents high or low expression); (D) PPI protein interaction network relationship diagram of DR-DEGs (red represents high level of interaction, green represents low level of interaction; (E) Analysis of the enrichment effect of DR-DEGs.

