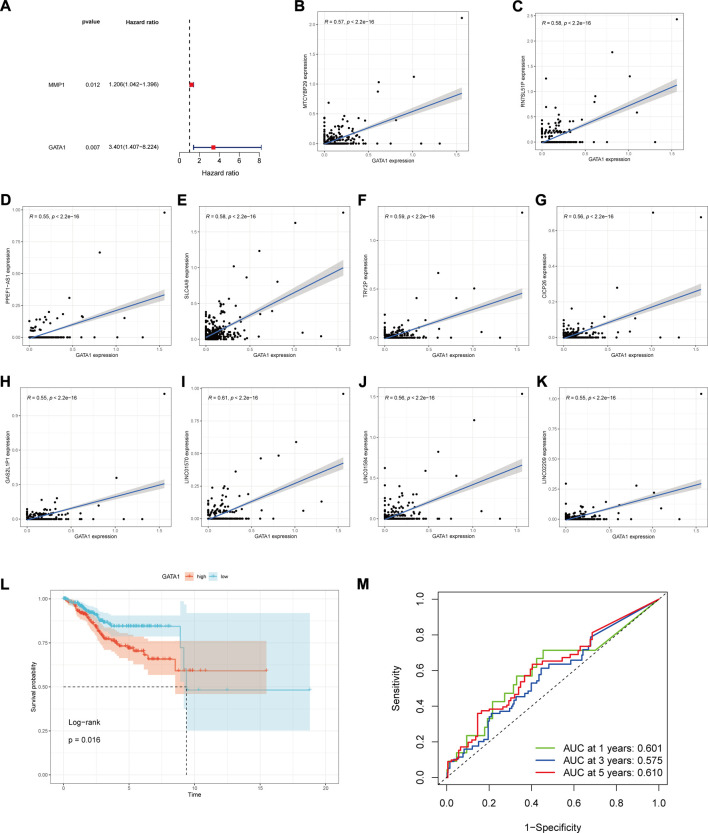
FIGURE 3.
GATA1 prognosis and gene correlation analysis. (A) Forest plots of DR-DEGs associated with UCEC prognosis were obtained by univariate COX regression analysis; (B–K) GATA1 correlation with MTCYBP29, RN7SL51P, PPEF1-AS1, SLC4A9, TRY2P, CICP26, GAS2L1P1, LINC01570, LINC01584, LINC02209 correlation analysis; (L) Kaplan-Meier analysis plot of prognostic correlation between high and low GATA1 expression groups; (M) Time-dependent ROC plot.

