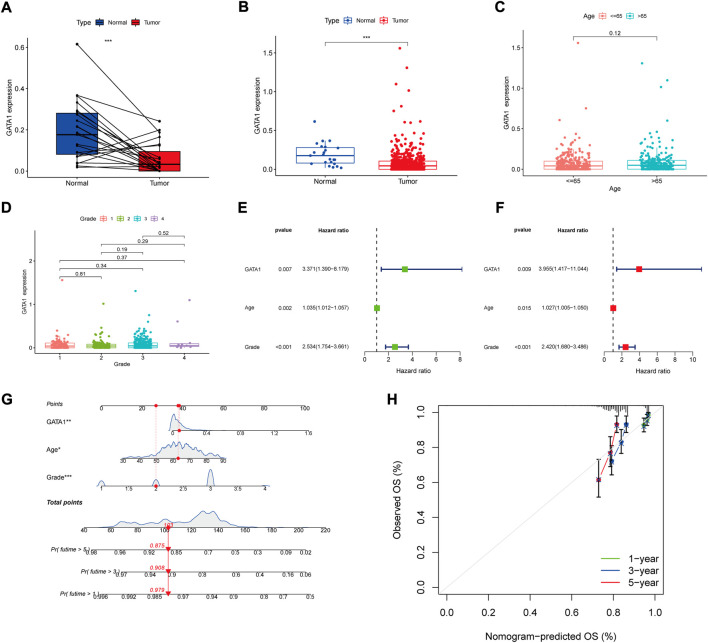
FIGURE 4.
GATA1 clinical correlation and independent prognostic analysis. (A) GATA1 expression in patients in the tumor group and in tumor and normal tissues; (B) GATA1 expression in patients in the normal and tumor groups; (C) GATA1 expression in samples from patients in different age groups; (D) GATA1 expression in samples from patients at different stages; (E,F) Univariate and multivariate Cox regression independent prognostic analyses; (G) Nomogram predicting 1-, 3- and 5-years survival rates in UCEC patients; (H) Columnar plot calibration curves for testing deviations between predicted and actual 1-, 3- and 5-years survival probabilities in nomogram.

