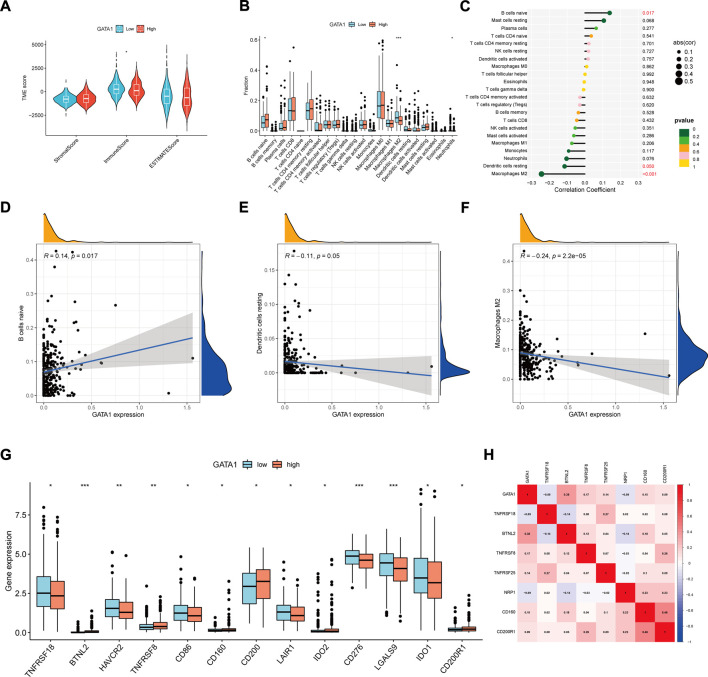
FIGURE 6.
Tumor microenvironment and immune correlation analysis: (A) Distribution of stromal, immune, and total scores in tumor microenvironment between high and low expression groups; (B) Analysis of immune cell infiltration in high and low expression groups; (C) Correlation between GATA1 and immune cells for analysis; (D–F) Relationship between GATA1 and B cells naïve, Dendritic cells resting, and Macrophages M2 expression; (G) Box line plot of immune checkpoint gene scores in high and low expression groups; (H) Co-expression relationship between GATA1 and immune checkpoint genes.

