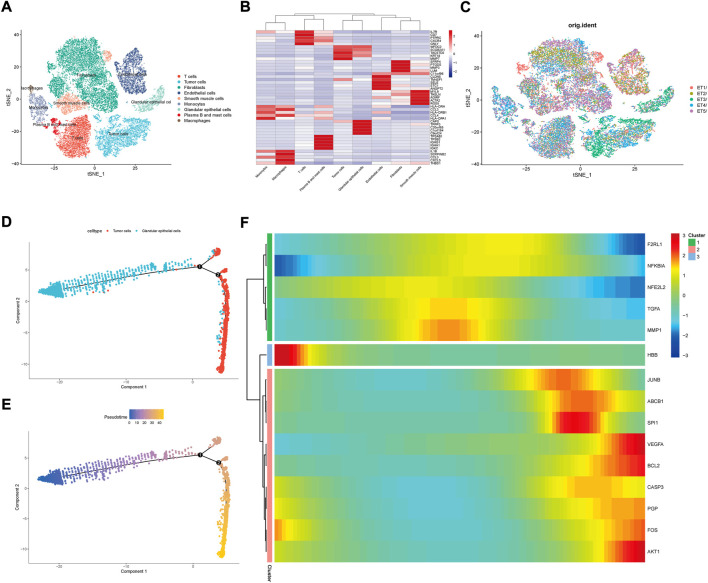
FIGURE 7.
Single-cell sequencing subgroups and cell trajectory analysis. (A) Nine major cell subgroups of UCEC tumor tissues were constructed by t-SNE analysis; (B) Visualization of Marker gene expression in the 9 cell subgroups; (C) Distribution of single-cell sequencing data from five UCEC patient samples in t-SNE analysis; (D,E) Glandular epithelial cells versus Tumor cells in cell trajectory analysis graphs; (F) Expression changes of DR-DEGs with cell trajectory.

