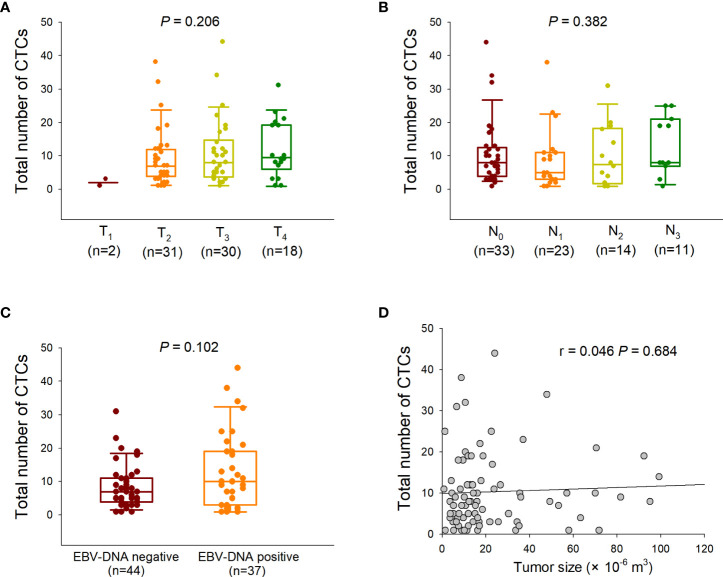
Figure 1.
Correlation between total circulating tumor cell (CTC) numbers and clinical characteristics. (A) Comparison of the total CTC numbers among different T stages (Kruskal–Wallis one-way analysis of variance). The CTC counts are presented as vertical boxes with error bars indicating the median, 10th, 25th, 75th, and 90th percentiles. (B) Comparison of the total CTC numbers among different N stages (Kruskal–Wallis one-way analysis of variance). (C) Comparison of the total CTC numbers between Epstein–Barr virus (EBV) DNA-negative and -positive groups (Mann–Whitney U test). (D) Correlation between the total CTC numbers and tumor sizes (Pearson correlation analysis).

