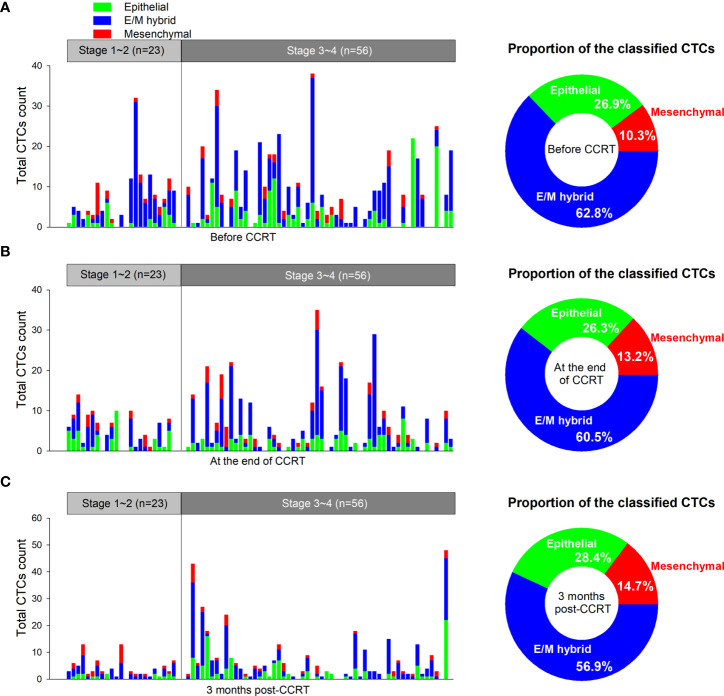
Figure 3.
Numbers and distributions of circulating tumor cells (CTCs) before and after concurrent chemoradiotherapy (CCRT). (A) The numbers and distributions of the CTCs detected from each patient before CCRT are shown as tricolored bars. The proportions of phenotypically classified CTC subpopulations determined before CCRT are shown as a pie plot in the right panel. (B) Detection of CTCs at the end of CCRT. (C) Detection of CTCs at 3 months after CCRT. E/M, epithelial/mesenchymal.

