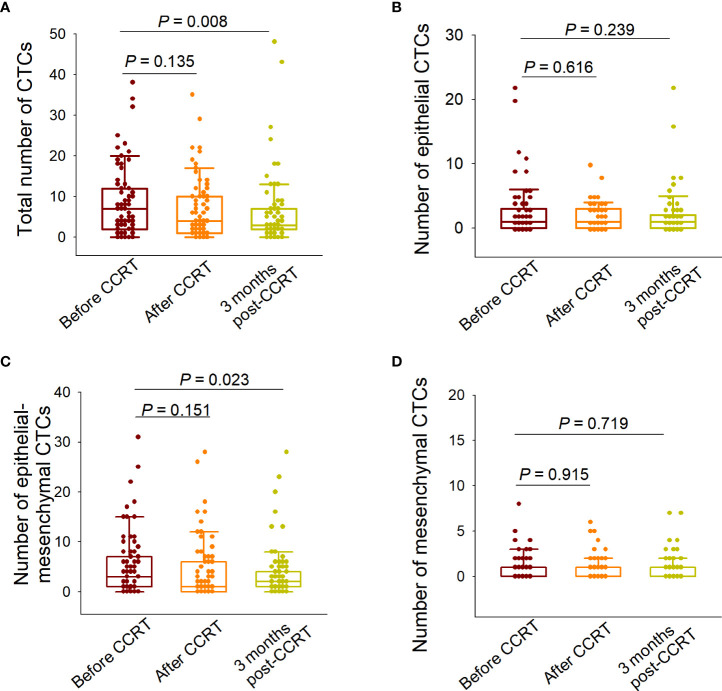
Figure 4.
Variations in the numbers of total circulating tumor cells (CTCs) and each subpopulation before and after concurrent chemoradiotherapy (CCRT). (A) Comparison of the total CTC numbers detected before CCRT, at the end of CCRT, and 3 months after CCRT. (B) Comparison of the numbers of epithelial CTCs detected at the three predesignated time points. (C) Comparison of the numbers of epithelial/mesenchymal (E/M) hybrid CTCs detected at the three predesignated time points. (D) Comparison of the numbers of mesenchymal CTCs detected at the three predesignated time points. The paired-sample Wilcoxon test was performed for between-group comparisons of CTC numbers.

