


FIGURE 12.
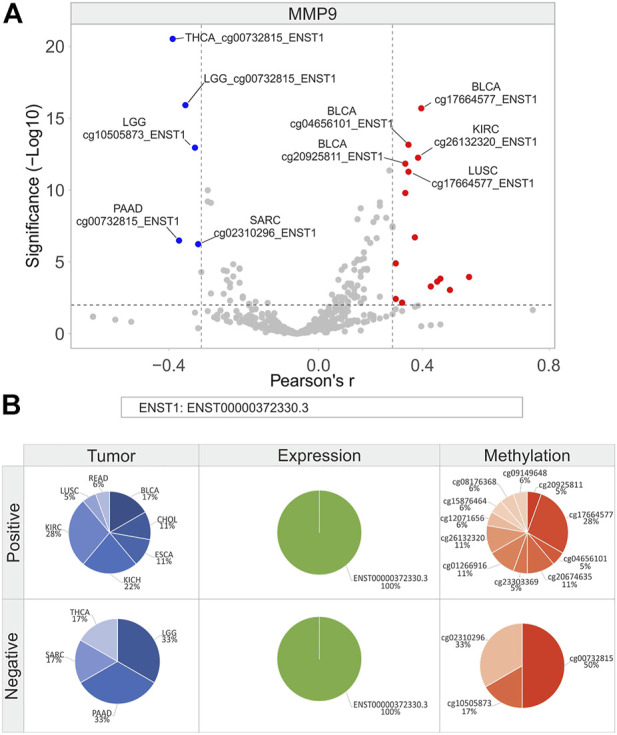
Correlation analysis between MMP9 isoforms expression and relative CG probesets methylation levels in each tumor type. (A) Volcano plot showing the correlation between CG probesets and isoforms expression of MMP9 (Pearson’s r ≥ 0.3 and ≤ −0.3, p ≤ 0.01). The top ten hits (five positive and five negative) based on correlation significance are labeled. Blue dots: negative correlation, red dots: positive correlation. (B) Percentage of tumor types, gene/isoforms and CG probesets showing Pearson’s r ≥ 0.3 and ≤ −0.3 (p ≤ 0.01), separately. No more than ten variables with the highest correlation values are indicated.