
FIGURE 14.
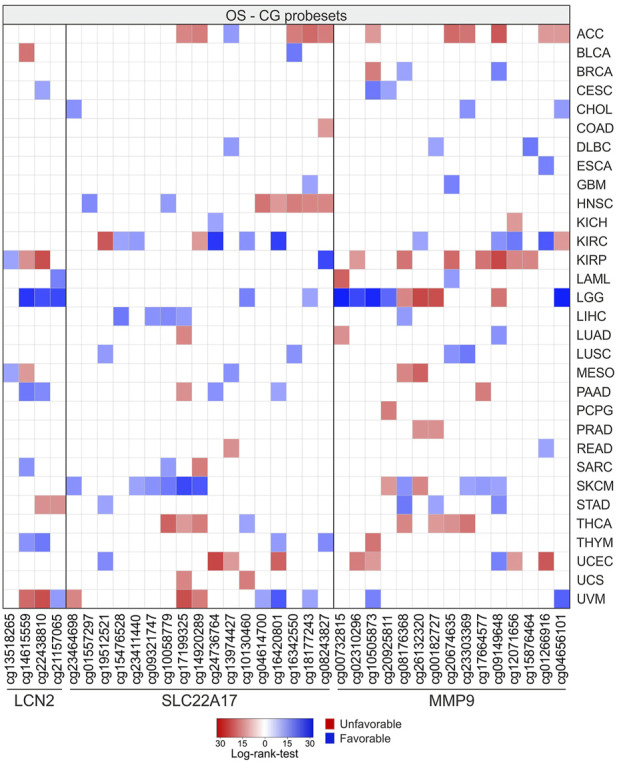
OS analysis according to methylation levels of CG probesets relative to LCN2, SLC22A17, and MMP9 in all tumor types. The CG probesets statistically associated (p ≤ 0.05) with OS are represented in the heatmap.
Official websites use .gov
A
.gov website belongs to an official
government organization in the United States.
Secure .gov websites use HTTPS
A lock (
) or https:// means you've safely
connected to the .gov website. Share sensitive
information only on official, secure websites.
OS analysis according to methylation levels of CG probesets relative to LCN2, SLC22A17, and MMP9 in all tumor types. The CG probesets statistically associated (p ≤ 0.05) with OS are represented in the heatmap.