
FIGURE 4.
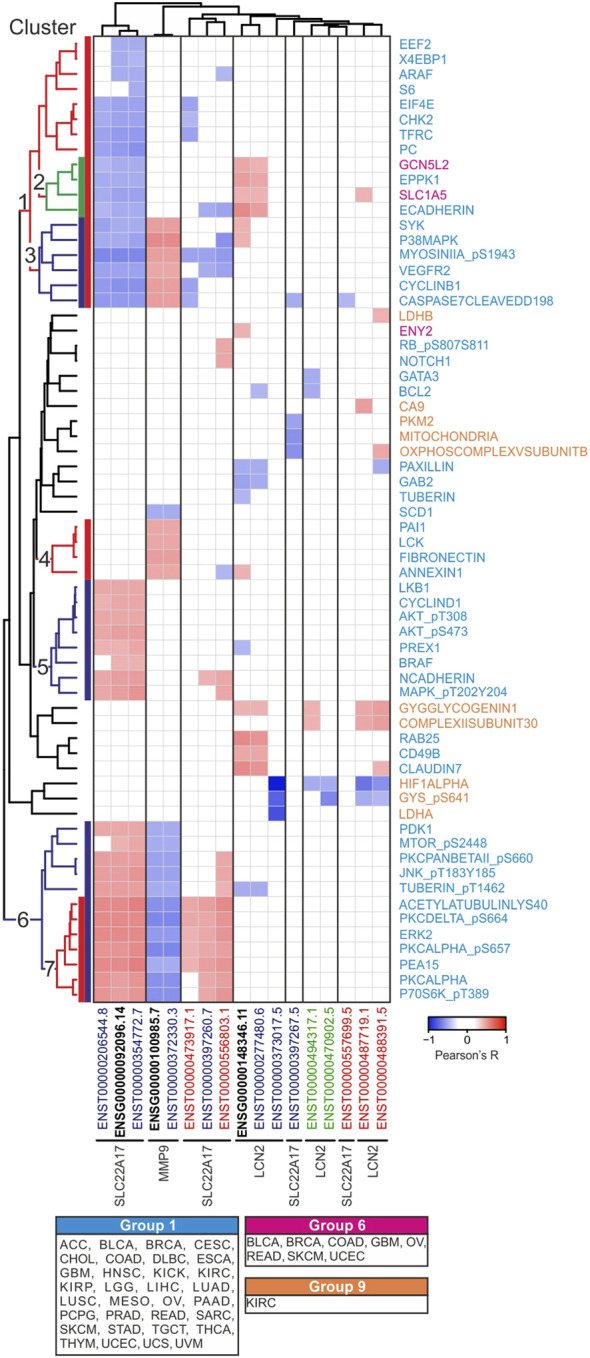
Correlation analysis between LCN2, SLC22A17, and MMP9 gene/isoforms expression and protein levels in PANCAN tumor samples. Correlation with Pearson’s r ≥ 0.3 or ≤ −0.3 and p ≤ 0.05 are included in the heatmap. The average linkage clustering method and Euclidean distance measurement method were applied for grouping similar data in seven representative clusters. Each protein is labeled with three different colors corresponding to 1, 6, and 9 tumor groups (Supplementary Table S6). Black bold labels indicate the LCN2, SLC22A17, and MMP9 genes (ENSG). Coding ENST isoforms: blue; non-coding ENST isoforms: green; retained intron ENST isoforms: red.