
FIGURE 7.
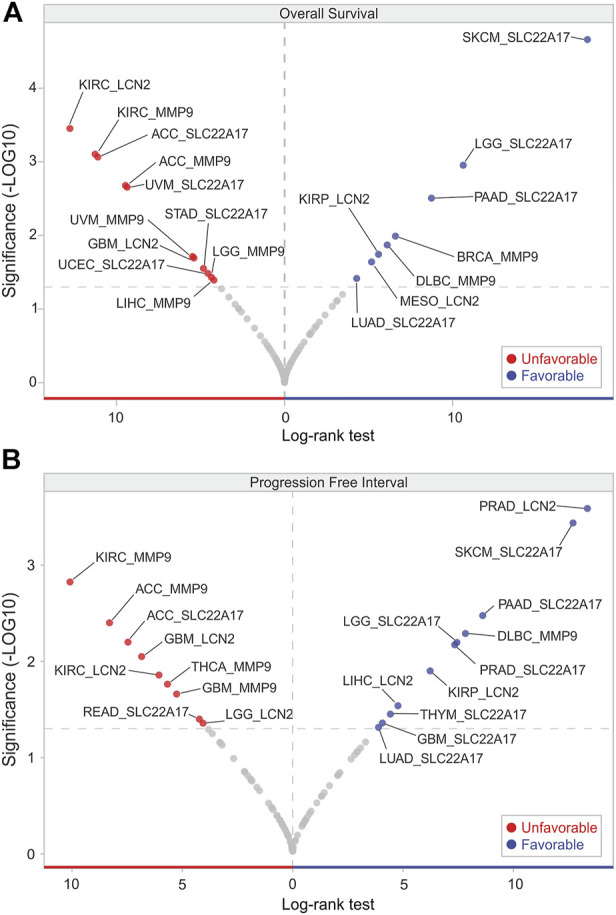
OS and PFI analyses according to LCN2, SCL22A17, and MMP9 gene expression. Volcano plot visualization of tumor types in which LCN2, SCL22A17, and MMP9 gene expression affected the patient’s overall survival (A) and progression free interval (B). The genes showing significant log-rank test (p ≤ 0.05) are represented in red (unfavorable) or in blue (favorable) according to their prognostic significance in each tumor type.