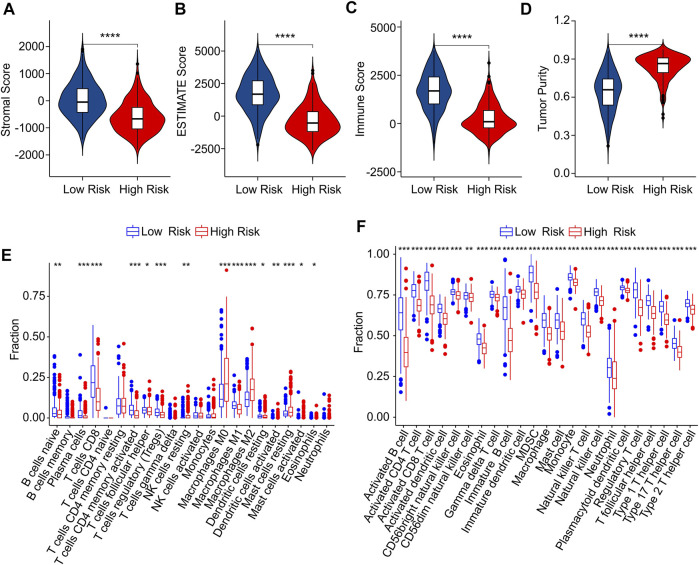
FIGURE 8.
Immune infiltration landscape analysis of CM patients in low- and high-risk group. (A) Stromal score. (B) ESTIMATE score. (C) Immune score. (D) Tumor purity. (E) The fraction of 22 immune cells in low- and high-risk group calculated by CIBERSORT algorithm. (F) The fraction of 23 immune cells low- and high-risk group calculated by ssGSEA algorithm.

