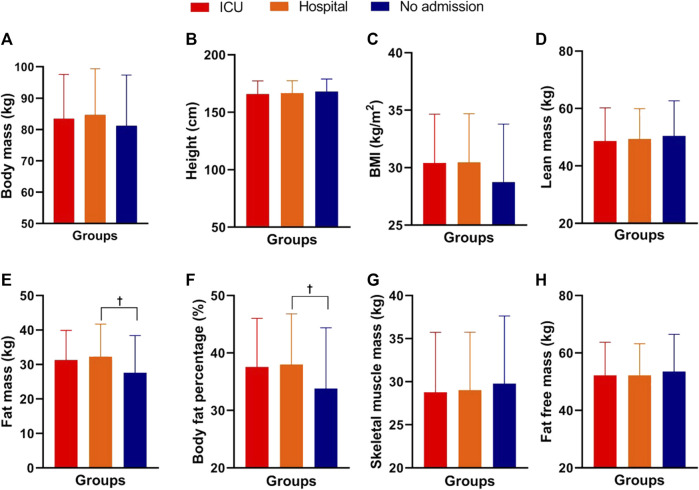
FIGURE 1.
Morphological parameters of male and female COVID-19 survivors in the ICU, hospitalized, and non-hospitalized groups. Note: data are presented as the mean and (±) standard deviation; Panel (A) = body mass; Panel (B) = height; Panel (C) = body mass index; Panel (D) = lean mass; Panel (E) = fat mass; Panel (F) = body fat percentage; Panel (G) = musculoskeletal mass; Panel (H) = fat-free mass; † = COVID-19 hospitalized group had significantly higher values than the non-hospitalized COVID-19 group. One-way ANOVA with Bonferroni post hoc test. Level of significance established = p < 0.05.

