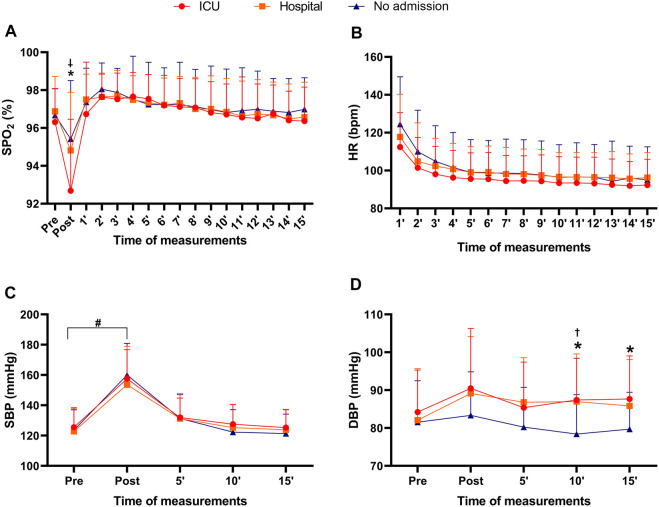
FIGURE 3.
Peripheral oxygen saturation, heart rate, systolic and diastolic blood pressure before, during, and after Bruce testing at different times in COVID-19 survivors in the ICU, hospitalized, and non-hospitalized groups. Note: data are presented as the mean and (±) standard deviation; Panel (A) = peripheral oxygen saturation before the Bruce test, subsequently after, and for 15 min after the test; Panel (B) = heart rate at the end of the Bruce test and for 15 min after the test; Panel (C) = pre-test systolic blood pressure, subsequently after the test, 5 min after the test, 10 min after the test and 15 min after the test; Panel (D) = pre-test diastolic blood pressure, subsequently after the test, 5 min after the test, 10 min after the test and 15 min after the test; %SPO2 = peripheral oxygen saturation; HR = heart rate; SBP = systolic blood pressure; DBP = diastolic blood pressure; * = significant difference between non-hospitalized and ICU; † = significant difference between the non-hospitalized and hospitalized; ‡ = significant difference between ICU and hospitalized; # = significant difference between pre and post times for the three experimental groups. Two-way ANOVA with Bonferroni post hoc test. Level of significance established = p < 0.05.

