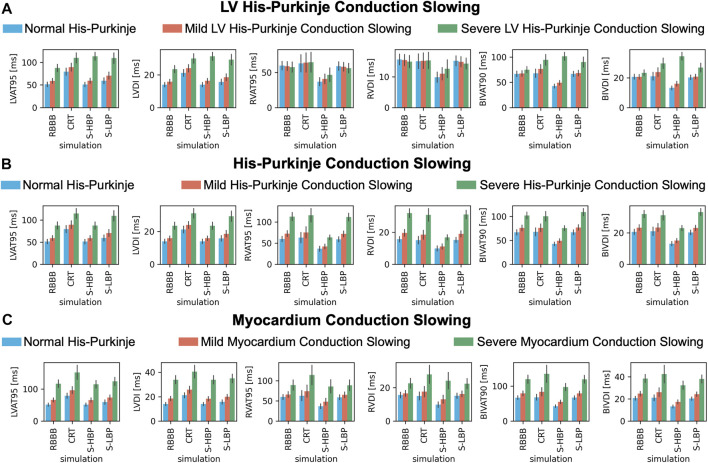
FIGURE 7.
Response with LV His-Purkinje, whole His-Purkinje and myocardium conduction slowing: LVAT-95, LVDI, RVAT-95, RVDI, BIVAT-90, and BIVDI simulated in the presence of proximal RBBB combined with otherwise normal His-Purkinje system (blue bars) and: (A) mild (orange bars) and severe (green bars) LV His-Purkinje conduction slowing; (B) mild (orange bars) and severe (green bars) His-Purkinje conduction slowing; (C) mild (orange bars) and severe (green bars) myocardium conduction slowing. Activation was simulated during baseline, standard CRT, selective HBP (S-HBP) and selective LBP (S-LBP). Results are presented as mean ± standard deviation.

