
FIGURE 1.
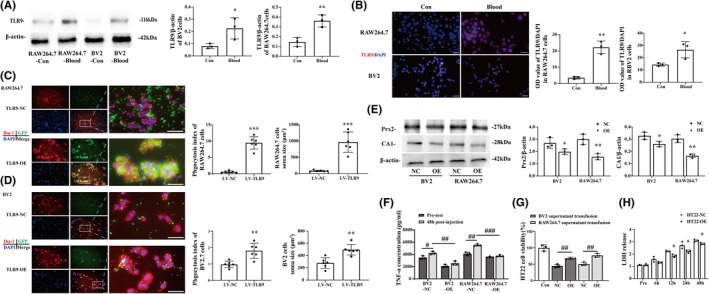
TLR9 expression elevated in macrophage and microglia cell lines and induced phagocytosis after blood infusion. (A) Western blot analysis of TLR9 protein level of BV2 and RAW264.7 cell lines 24 h after mouse whole blood injection, n = 3 for each group. (B) Immunofluorescence staining using TLR9 antibody in BV2 and RAW264.7 cell lines 24 h after mouse whole blood injection. Scale bar = 20 μm, *p < 0.05, **p < 0.01 vs. control group by Student's t‐test, n = 3 for each group. (C, D) Immunofluorescence staining using Iba‐1 (red) in RAW264.7 and BV2 cell lines 24 h after injecting whole blood obtained from EGFPTg/+ mouse. The phagocytosis index and cell soma size were quantified in each group. Scale bars: low magnification = 20 μm, high magnification = 10 μm. # p < 0.05, ## p < 0.01, ### p < 0.001 vs. LV‐NC group by Student's t‐test. Values are mean ± SD, n = 6 for each group. (E) Western blot analysis of CA1 and Prx2 protein level of supernatant obtained from BV2 and RAW264.7 cell lines transfected with either NC or OE lentivirus 24 h after mouse whole blood injection. *p < 0.05, **p < 0.01 vs. NC group by Student's t‐test. (F) ELISA analysis of TNF‐α level of supernatant obtained from BV2 and RAW264.7 cell lines transfected with either NC or OE lentivirus before and 24 h after mouse whole blood injection. # p < 0.05, ## p < 0.01, ### p < 0.001 by two‐way ANOVA. (G) CCK‐8 assay of HT22 cell line transfused with different supernatant from blood‐cultured BV2 and RAW264.7 cell lines with or without TLR9 overexpression. (H) LDH release assay of HT22 with or without TLR9 overexpression 24 h after mouse whole blood injection. *p < 0.05, **p < 0.01 vs. NC group. # p < 0.05, ## p < 0.01, ### p < 0.001 by two‐way ANOVA. Values are mean ± SD, n = 3 for each group