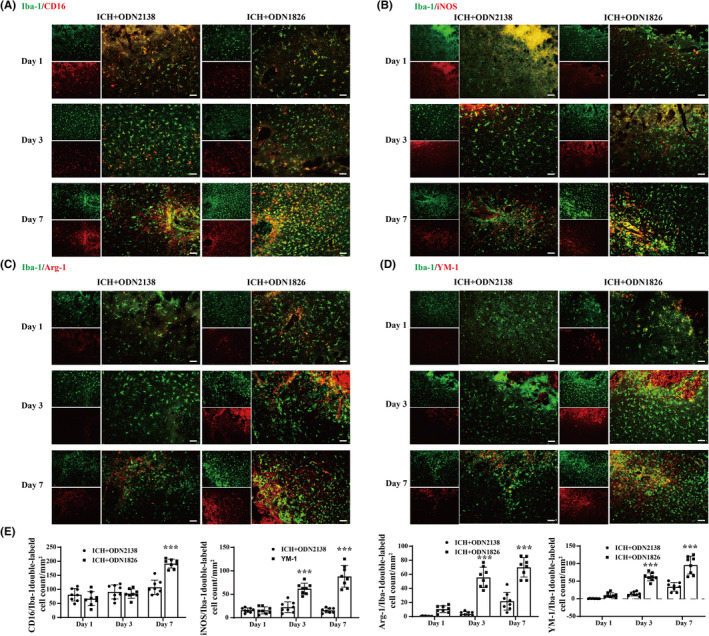
FIGURE 5.

TLR9 participated in M/Ms polarization. (A) Immunofluorescence staining using Iba‐1 and CD16 in male mice at day 1, day 3, and day 7 after ICH with ODN2138 or ODN1826 treatment. (B) Immunofluorescence staining using Iba‐1 and iNOS in male mice at day 1, day 3, and day 7 after ICH with ODN2138 or ODN1826 treatment. (C) Immunofluorescence staining using Iba‐1 and Arg‐1 in male mice at day 1, day 3, and day 7 after ICH with ODN2138 or ODN1826 treatment. (D) Immunofluorescence staining using Iba‐1 and YM‐1 in male mice at day 1, day 3, and day 7 after ICH with ODN2138 or ODN1826 treatment. (E) Quantification of double‐labeled cell count in each groups at all three time points. Scale bar = 50 μm. n = 8 for each group. Values are mean ± SD. **p < 0.01, ***p < 0.001 vs. ICH + ODN2138 group by two‐way ANOVA
