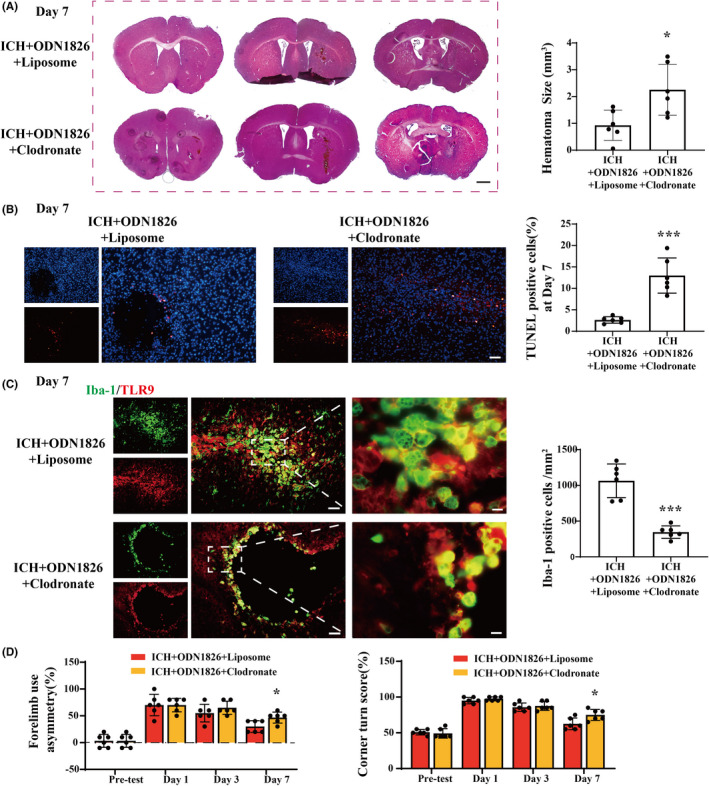
FIGURE 6.

Clodronate liposome abolished the TLR9‐induced neuroprotection effect after ICH. (A) HE staining of male mice brain after ICH with ODN1826 + clodronate or ODN1826 + liposome interventions at day 7. The hematoma size of each group was calculated. Scale bar = 500 μm. **p < 0.01 vs. ICH + ODN1826 + liposome group by Student's t‐test. (B) TUNEL staining (red) with DAPI (blue) of ODN1826 + clodronate‐treated mice and ODN1826 + control liposome‐treated mice ipsilateral BG at day 7 after ICH, and the TUNEL‐positive cell percentage of each group were quantified. Scale bar = 50 μm. ***p < 0.001 vs. ICH + ODN1826 + liposome group by Student's t‐test. (C) Immunofluorescence staining using Iba‐1 and TLR9 at day 7 after ICH with ODN1826 + clodronate or ODN1826 + control liposome treatment. Scale bar: low magnification = 50 μm, high magnification = 10 μm. ***p < 0.001 vs. ICH + ODN1826 + liposome group by Student's t‐test. (D) Forelimb use asymmetry and corner turn scores before and after ICH with ODN1826 + clodronate or ODN1826 + liposome treatment. *p < 0.05, **p < 0.01, ***p < 0.001 vs. ICH + ODN1826 + liposome group. n = 6 for each group. Values are mean ± SD
