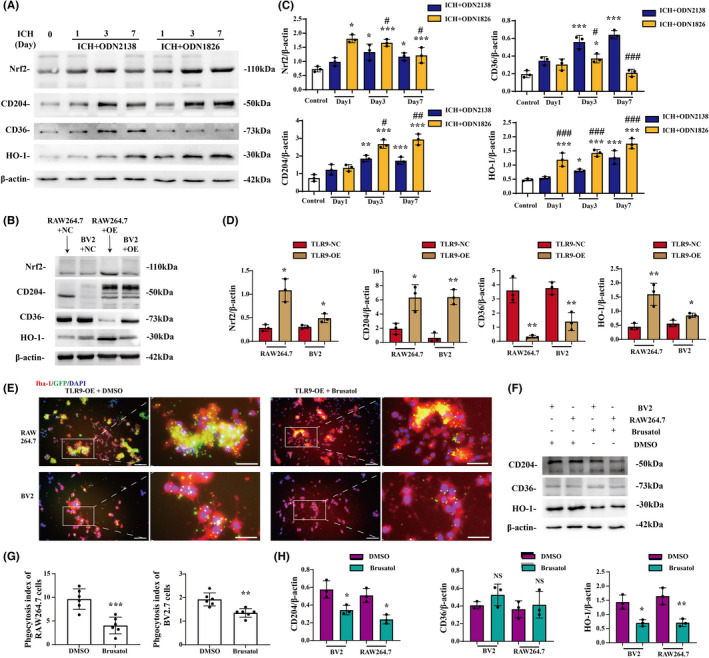
FIGURE 7.

Nrf2/CD204/HO‐1 pathway participated in TLR9‐induced M/M phagocytosis. (A) Representative western blots of Nrf2, CD204, CD36, and HO‐1 expression in the ipsilateral basal ganglia tissue of ICH mice with ODN2138 or ODN1826 treatment. (B) Representative western blots of Nrf2, CD204, CD36, and HO‐1 expression in the blood‐injected BV2 and RAW264.7 cell lines with or without TLR9 overexpression. (C) The relative protein expression level quantification of mice in different groups. *p < 0.05, **p < 0.01, ***p < 0.001 vs. control group, and # p < 0.05, ## p < 0.01, ### p < 0.001 vs. ICH + ODN2138 group by two‐way ANOVA. Values are mean ± SD, n = 3 for each group. (D) The relative quantification of protein expression in different cell line groups. *p < 0.05, **p < 0.01 vs. TLR9‐NC group by two‐way ANOVA. Values are mean ± SD, n = 3 for each group. (E) Immunofluorescence staining using Iba‐1 (red) in TLR9‐overexpressed, DMSO, or brusatol pretreated RAW264.7 and BV2 cell lines 24 hours after injecting whole blood obtained from EGFPTg/+ mouse. (F) Representative western blots of CD204, CD36, and HO‐1 expression in TLR9‐overexpressed, DMSO, or brusatol pretreated RAW264.7 and BV2 cell lines 24 h after whole blood injection. (G) The phagocytosis indices were quantified in each group. Scale bars: low magnification = 20 μm, high magnification = 10 μm. **p < 0.001, ***p < 0.001 vs. DMSO‐treated group by Student's t‐test. (H) The relative quantification of protein expression in different groups. *p < 0.05, **p < 0.01 vs. DMSO‐treated group by two‐way ANOVA. Values are mean ± SD, n = 3 for each group
