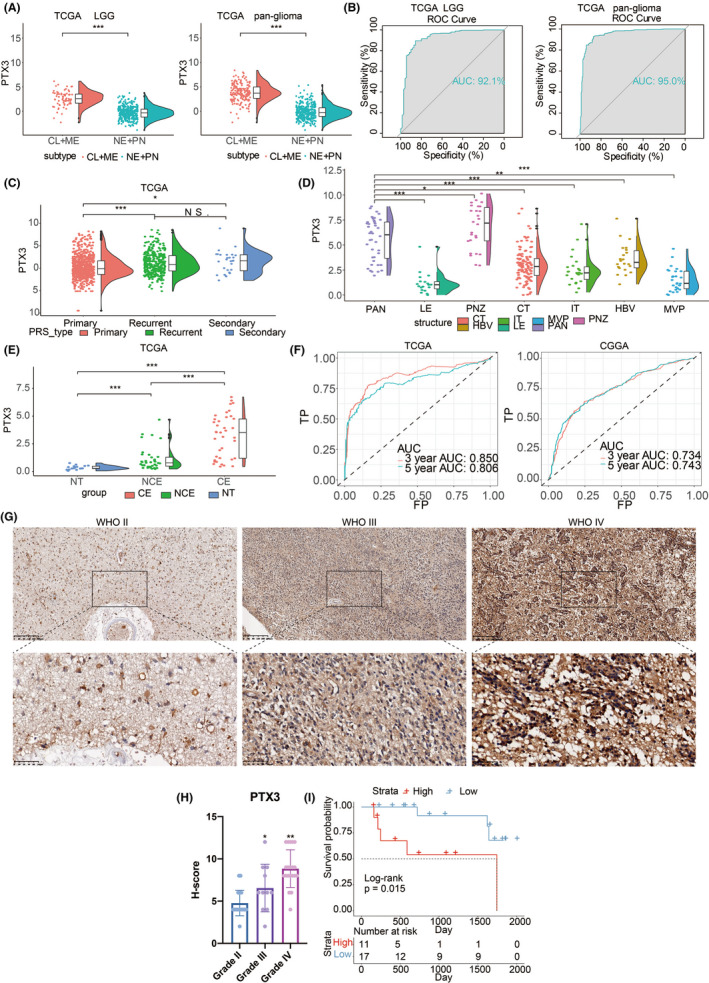
FIGURE 1.

Inter‐tumor and intra‐tumor heterogeneous expression characteristics of PTX3 in gliomas. (A) PTX3 expression in proneural, neural, classical, and mesenchymal subtypes in the TCGA dataset. (B) The ROC curve indicates the sensitivity and specificity of PTX3 expression in predicting the ME and CL subtypes. (C) PTX3 expression in primary, secondary, and recurrent gliomas in the TCGA dataset. (D) Intra‐tumor distribution of PTX3 in LE (Leading Edge), IT (Infiltrating Tumor), CT (Cellular Tumor), PAN (Pseudopalisading Cells Around Necrosis), PNZ (Perinecrotic Zone), MVP (Microvascular Proliferation), and HBV (Hyperplastic Blood Vessels) regions based on Ivy GBM RNA‐seq data. (E) PTX3 expression in different radiographical regions in the TCGA dataset. CE, contrast‐enhanced; NCE, non‐contrast‐enhanced; NT, normal tissue. (F) The ROC curves indicate the sensitivity and specificity of PTX3 in predicting 3‐year and 5‐year survival in the TCGA and CGGA datasets. (G) Representative images of IHC staining for PTX3 in different pathological grades of gliomas in Xiangya cohort. (H) Statistical analysis of H‐score regarding PTX3 expression in Xiangya cohort. (I) Kaplan–Meier analysis of OS of glioma patients based on high vs. low expression of PTX3 (H‐score) in Xiangya cohort.
