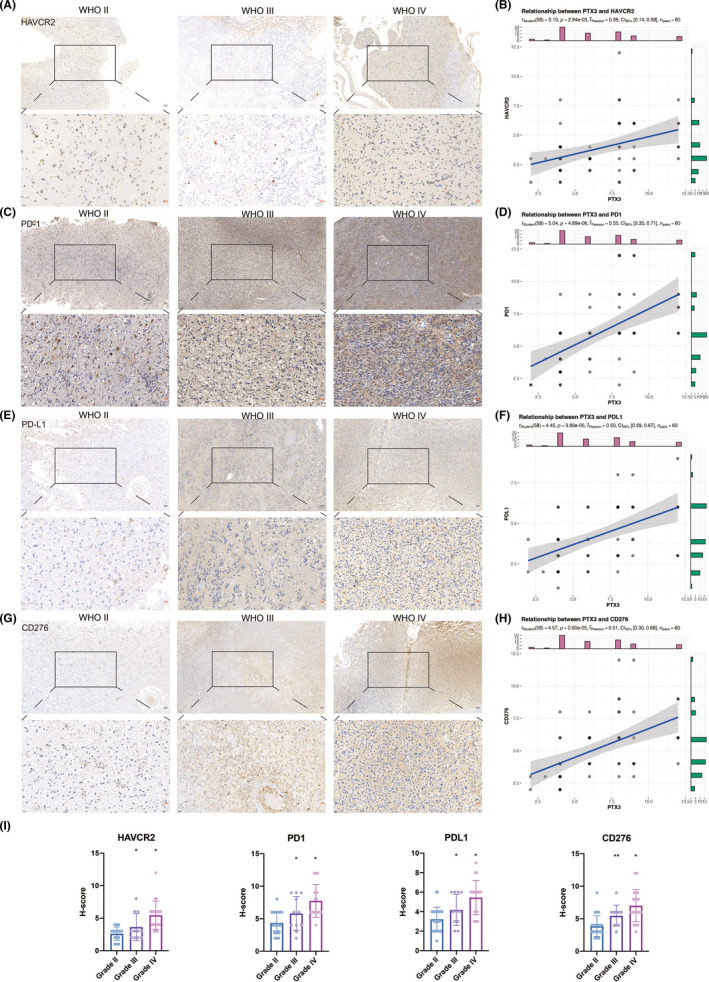
FIGURE 2.

IHC staining for classical immune checkpoints. (A) Representative images of IHC staining for HAVCR2 in different pathological grades of gliomas. (B) Scattering plot depicting the correlation between HAVCR2 and PTX3 based on the H‐score. (C) Representative images of IHC staining for PD‐1 in different pathological grades of gliomas. (D) Scattering plot depicting the correlation between PD‐1and PTX3 based on the H‐score. (E) Representative images of IHC staining for PD‐L1 in different pathological grades of gliomas. (F) Scattering plot depicting the correlation between PD‐L1and PTX3 based on the H‐score. (G) Representative images of IHC staining for CD276 in different pathological grades of gliomas. (H) Scattering plot depicting the correlation between CD276 and PTX3 based on the H‐score. (I) Statistical analysis of H‐score regarding HAVCR2, PD‐1, PD‐L1, and CD276 expression in Xiangya cohort.
