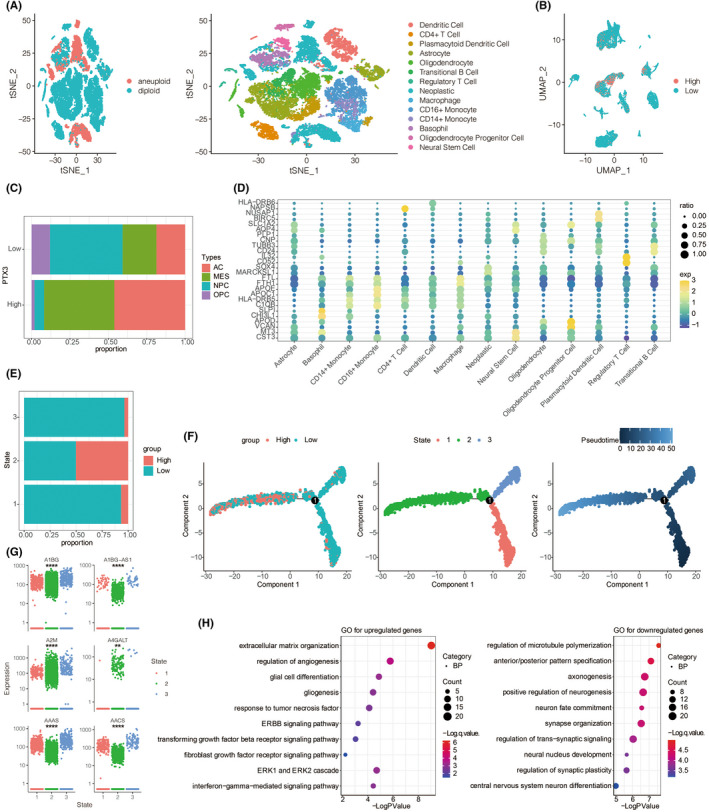
FIGURE 3.

Molecular features of PTX3 at the single‐cell level. (A) t‐SNE for the dimension reduction and visualization of aneuploid cells, diploid cells, and other 14 cell types within the tumor microenvironment. (B) UMAP for the dimension reduction and visualization of cells with high or low PTX3 expression. (C) Relative proportion of four cell types in cells with high or low PTX3 expression. (D) The differentially expressed genes among the identified 14 cell types. E. PTX3 expression in three cell states based on pseudotime analysis. (F) Pseudotime trajectory analysis based on PTX3 expression. (G) Top six differentially expressed genes between high and low PTX3 expression. (H) GO and KEGG enrichment analysis of differentially expressed genes between high and low PTX3 expression.
