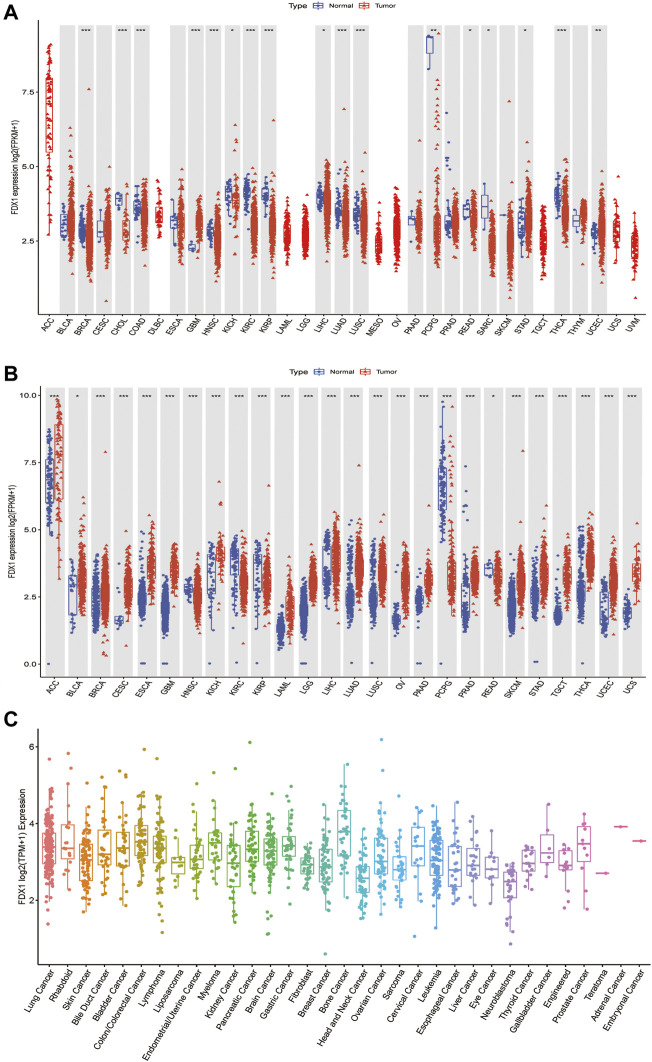
FIGURE 1.
Differential expression of FDX1. (A) Comparison of FDX1 expressions between tumors and normal samples in the TCGA database. (B) Comparison of FDX1 expressions between tumors and normal samples in the TCGA and the GTEx databases. (C) FDX1 expression in tumor cell lines. Log2 (FPKM+1) and log2 (TPM+1) are used for the logarithmic scale. *p < 0.05, **p < 0.01, ***p < 0.001.

