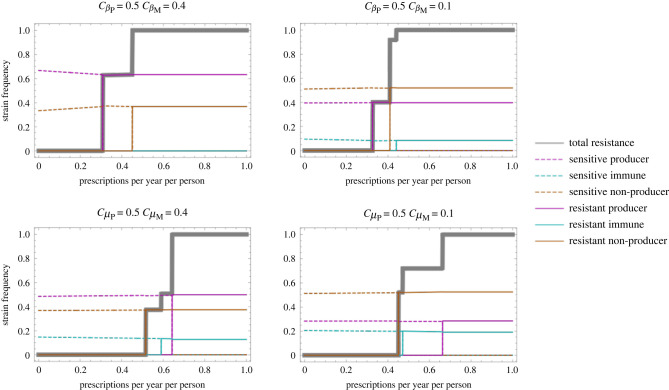
Figure 5.
Strain frequencies (colours) and overall resistance frequency (grey) as a function of the population antibiotic consumption rate (τ) for different costs of the producer and immune strains. indicates cost in transmission and indicates cost in clearance, with P and M indicating the cost to the producer and immune strain, respectively: in the top row, bacteriocin-associated costs affect transmission, in the bottom row these affect clearance. The cost of antibiotic resistance (cR = 0.025) is modelled as affecting transmission (see electronic supplementary material, section 2.6 for antibiotic resistance costs modelled as affecting clearance). Other parameters are β = 3, μ = 1, kPN = 1, kMP = kNM = 0.5. The model is parameterized such that the values of the rate parameters in units of month−1 are plausible for S. pneumoniae [28]. Due to the difficulty of computing equilibrium solutions and eigenvalues for this model, these results are derived through simulating rather than stability analysis (simulation until ).

