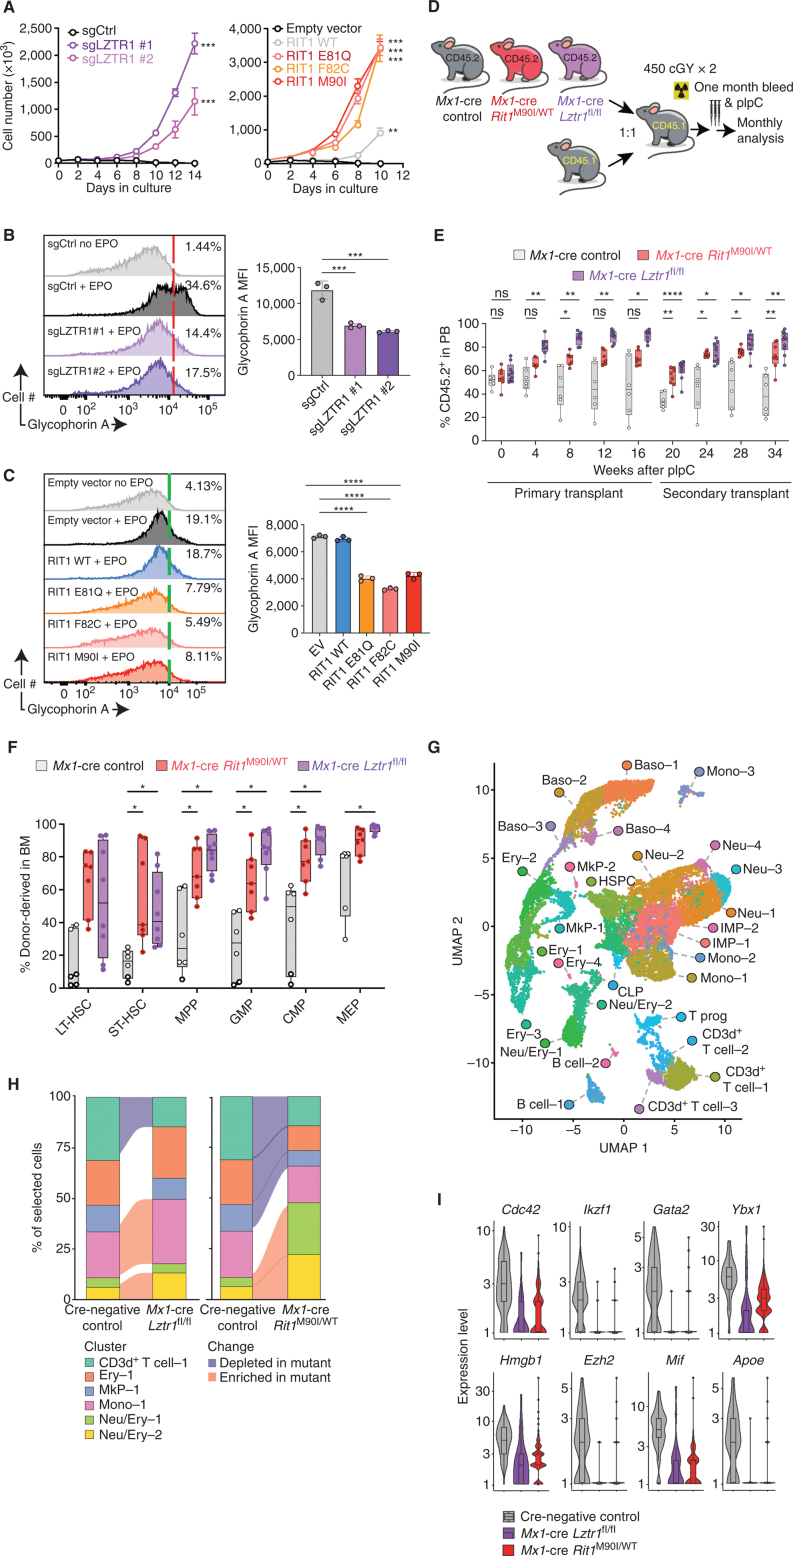
Figure 3.
Convergent effects of Lztr1 deletion and leukemia-associated mutations in the Lztr1 substrate Rit1 in normal hematopoiesis. A, Growth of cells from G following cytokine depletion. Mean ± SD. n = 3. **, P < 0.01; ***, P < 0.001. sg, single guide. B, Left, representative FACS histograms of glycophorin A levels in TF-1 cells ± LZTR1 deletion in the absence or presence of erythropoietin (EPO; 2 IU/mL × 4 days). Right, enumeration of the median fluorescence intensity (MFI) of glycophorin A. n = 3. ***, P < 0.001. C, As in B but in TF-1 cells with RIT1 mutants. n = 3. ****, P < 0.0001. D, Schema for competitive transplantation of hematopoietic cells with postnatal deletion of Lztr1 or expression of Rit1M90I/WT. pIpC, polyinosinic:polycytidylic acid. E, Peripheral blood (PB) chimerism of CD45.1 recipient mice from D. n = 6–9. ns, not significant; *, P < 0.05; **, P < 0.01; ****, P < 0.0001. F, percentage of CD45.2+ hematopoietic stem and progenitor cells in the bone marrow (BM) of CD45.1 recipient mice from D at 16 weeks after transplantation. n = 6–9. *, P < 0.05. For box-and-whisker plots, bar indicates median; box edges, first and third quartile values; and whisker edges, minimum and maximum values. CMP, common myeloid progenitor; GMP, granulocyte–macrophage progenitor; LT-HSC, long-term HSC; LSK, lineage-negative Sca-1+ c-Kit+; MEP, megakaryocyte–erythroid progenitor; MPP, multipotent progenitor; ST, short-term HSC. G, Uniform manifold approximation and projection (UMAP) dimensionality reduction of 20,536 bone marrow lineage-negative cells from Cre-negative control mice, Mx1-cre Lztr1fl/fl mice, and Mx1-cre Rit1M90I/WT mice. Baso, basophil progenitor; B cell, B-cell progenitor; CD3d+ T cell, CD3d+ T-cell progenitor; CLP, common lymphoid progenitor; Ery, erythroid progenitor; HSPC, hematopoietic stem/progenitor cell; IMP, immature myeloid progenitor; MkP, megakaryocyte progenitor; Mono, monocyte progenitor; Neu, neutrophil/granulocyte progenitor; Neu/Ery, neutrophil/erythroid progenitor; T prog, T-cell progenitor. H, Alluvial plots of key clusters from A, including all differentially expanded or reduced populations in mutant mice compared with controls. Shaded sections represent populations differentially represented in mutant animals compared with WT. I, Violin plots of log-transformed normalized gene expression for genes differentially expressed in the Neu/Ery–1 cluster in mutant animals compared with controls. Superimposed box-and-whisker plots represent median values within the interquartile range (IQR; boxes) and 1.5 × IQR (whiskers).

